バージニア州の白人比率ランキング
バージニア州の134郡を対象とした白人比率についてのランキングです。アメリカ合衆国における「郡」(countyまたはcounty-equivalent)は、州(state)の下の行政区画です。
人種(Race)ごとの細かな統計が公表されることも、“人種のサラダボウル”(以前はるつぼ)たるアメリカ独特のものです。人口の大部分を占めるであろう白人に関する項目が、黒人・アフリカ系やアジア系などと全く同様に存在しており、“差別”ではなく人種の“区別”としての位置付けを明確にしています。
なお、白人、黒人・アフリカ系、アジア系などの人種(Race)のうち、異なる人種の混血の方(ハーフやクォーターなど)は含みません。
バージニア州のランキングの1位はDickenson Countyの98.80%、2位はCraig Countyの98.69%、3位はHighland Countyの98.62%です。
バージニア州のランキングの最下位(134位)はPetersburg cityの16.09%です。
このランキングには、ランキングマップがあります。偏差値にしたがって地図上の地域を色分けすることで、ひと目で白人比率の状況が分かるようになっています。
全米・白人比率ランキング(州別)や全米・白人比率ランキング(郡別)もあります。全米の郡別ランキングはサイズの大きなページとなるため、お使いのインターネット環境によっては、読み込みに時間がかかる場合があります。
バージニア州のページではバージニア州についてのすべてのランキング順位を確認できます。
| 順位 | 郡 | 白人比率 |
白人人口 |
人口 |
偏差値 | 評価 |
|---|
| 1 | Dickenson County |
98.80% |
  |
15,712人 | 15,903人 | 63.6 | - |
| 2 | Craig County |
98.69% |
|
5,122人 | 5,190人 | 63.6 | - |
| 3 | Highland County |
98.62% |
|
2,289人 | 2,321人 | 63.5 | - |
| 4 | Scott County |
97.94% |
|
22,700人 | 23,177人 | 63.1 | - |
| 5 | Russell County |
97.83% |
|
28,270人 | 28,897人 | 63.1 | - |
| 6 | Carroll County |
97.09% |
|
29,168人 | 30,042人 | 62.6 | - |
| 7 | Washington County |
97.04% |
|
53,249人 | 54,876人 | 62.6 | - |
| 8 | Giles County |
96.74% |
|
16,723人 | 17,286人 | 62.4 | - |
| 9 | Buchanan County |
96.57% |
|
23,271人 | 24,098人 | 62.3 | - |
| 10 | Floyd County |
95.95% |
|
14,660人 | 15,279人 | 62.0 | - |
| 11 | Page County |
95.93% |
|
23,063人 | 24,042人 | 62.0 | - |
| 12 | Smyth County |
95.77% |
|
30,847人 | 32,208人 | 61.9 | - |
| 13 | Bland County |
95.50% |
|
6,517人 | 6,824人 | 61.7 | - |
| 14 | Grayson County |
95.29% |
|
14,802人 | 15,533人 | 61.6 | - |
| 15 | Poquoson city |
95.12% |
|
11,557人 | 12,150人 | 61.5 | - |
| 16 | Tazewell County |
95.10% |
|
42,868人 | 45,078人 | 61.5 | - |
| 17 | Wythe County |
95.06% |
|
27,790人 | 29,235人 | 61.5 | - |
| 18 | Botetourt County |
94.93% |
|
31,469人 | 33,148人 | 61.4 | - |
| 19 | Rockbridge County |
94.58% |
|
21,097人 | 22,307人 | 61.2 | - |
| 20 | Lee County |
94.16% |
|
24,092人 | 25,587人 | 61.0 | - |
| 21 | Bath County |
93.68% |
|
4,432人 | 4,731人 | 60.7 | - |
| 22 | Augusta County |
93.35% |
|
68,848人 | 73,750人 | 60.5 | - |
| 23 | Rockingham County |
93.28% |
|
71,182人 | 76,314人 | 60.5 | - |
| 24 | Alleghany County |
93.20% |
|
15,145人 | 16,250人 | 60.4 | - |
| 25 | Shenandoah County |
93.04% |
|
39,070人 | 41,993人 | 60.3 | - |
| 26 | Wise County |
93.03% |
|
38,561人 | 41,452人 | 60.3 | - |
| 27 | Rappahannock County |
92.69% |
|
6,834人 | 7,373人 | 60.1 | - |
| 28 | Pulaski County |
92.48% |
|
32,250人 | 34,872人 | 60.0 | - |
| 29 | Bedford County |
91.41% |
|
62,775人 | 68,676人 | 59.4 | - |
| 30 | Patrick County |
91.11% |
|
16,847人 | 18,490人 | 59.2 | - |
| 31 | Buena Vista city |
90.98% |
|
6,050人 | 6,650人 | 59.1 | - |
| 32 | Bristol city |
90.91% |
|
16,214人 | 17,835人 | 59.1 | - |
| 33 | Warren County |
90.87% |
|
34,144人 | 37,575人 | 59.1 | - |
| 34 | Clarke County |
90.22% |
|
12,662人 | 14,034人 | 58.7 | - |
| 35 | Roanoke County |
90.00% |
|
83,140人 | 92,376人 | 58.6 | - |
| 36 | Frederick County |
89.31% |
|
69,934人 | 78,305人 | 58.2 | - |
| 37 | Norton city |
88.68% |
|
3,510人 | 3,958人 | 57.8 | - |
| 38 | Franklin County |
88.50% |
|
49,699人 | 56,159人 | 57.7 | - |
| 39 | Salem city |
88.19% |
|
21,872人 | 24,802人 | 57.5 | - |
| 40 | Mathews County |
87.97% |
|
7,898人 | 8,978人 | 57.4 | - |
| 41 | Greene County |
87.61% |
|
16,123人 | 18,403人 | 57.2 | - |
| 42 | Montgomery County |
87.55% |
|
82,643人 | 94,392人 | 57.2 | - |
| 43 | Gloucester County |
87.22% |
|
32,149人 | 36,858人 | 57.0 | - |
| 44 | Radford city |
86.99% |
|
14,273人 | 16,408人 | 56.9 | - |
| 45 | Madison County |
86.74% |
|
11,543人 | 13,308人 | 56.7 | - |
| 46 | Hanover County |
86.67% |
|
86,550人 | 99,863人 | 56.7 | - |
| 47 | Galax city |
85.83% |
|
6,044人 | 7,042人 | 56.2 | - |
| 48 | Fauquier County |
85.28% |
|
55,607人 | 65,203人 | 55.9 | - |
| 49 | Lexington city |
85.25% |
|
6,003人 | 7,042人 | 55.9 | - |
| 50 | Covington city |
84.11% |
|
5,014人 | 5,961人 | 55.2 | - |
| 51 | Powhatan County |
83.84% |
|
23,515人 | 28,046人 | 55.1 | - |
| 52 | Staunton city |
83.69% |
|
19,874人 | 23,746人 | 55.0 | - |
| 53 | Nelson County |
83.28% |
|
12,509人 | 15,020人 | 54.7 | - |
| 54 | Orange County |
82.39% |
|
27,584人 | 33,481人 | 54.2 | - |
| 55 | Colonial Heights city |
82.28% |
|
14,326人 | 17,411人 | 54.2 | - |
| 56 | Waynesboro city |
82.23% |
|
17,274人 | 21,006人 | 54.1 | - |
| 57 | Campbell County |
82.10% |
|
45,024人 | 54,842人 | 54.1 | - |
| 58 | New Kent County |
81.70% |
|
15,057人 | 18,429人 | 53.8 | - |
| 59 | Fluvanna County |
80.74% |
|
20,743人 | 25,691人 | 53.3 | - |
| 60 | Albemarle County |
80.57% |
|
79,738人 | 98,970人 | 53.2 | - |
| 61 | James City County |
80.28% |
|
53,792人 | 67,009人 | 53.0 | - |
| 62 | Falls Church city |
79.90% |
|
9,853人 | 12,332人 | 52.8 | - |
| 63 | Middlesex County |
79.20% |
|
8,680人 | 10,959人 | 52.4 | - |
| 64 | Harrisonburg city |
78.45% |
|
38,371人 | 48,914人 | 52.0 | - |
| 65 | Louisa County |
78.41% |
|
25,996人 | 33,153人 | 51.9 | - |
| 66 | Appomattox County |
77.45% |
|
11,597人 | 14,973人 | 51.4 | - |
| 67 | Goochland County |
77.45% |
|
16,820人 | 21,717人 | 51.4 | - |
| 68 | King William County |
77.17% |
|
12,297人 | 15,935人 | 51.2 | - |
| 69 | Amherst County |
76.74% |
|
24,829人 | 32,353人 | 51.0 | - |
| 70 | King George County |
76.70% |
|
18,089人 | 23,584人 | 51.0 | - |
| 71 | York County |
76.43% |
|
50,031人 | 65,464人 | 50.8 | - |
| 72 | Bedford city |
76.42% |
|
4,755人 | 6,222人 | 50.8 | - |
| 73 | Spotsylvania County |
75.53% |
|
92,452人 | 122,397人 | 50.3 | - |
| 74 | Pittsylvania County |
75.45% |
|
47,918人 | 63,506人 | 50.2 | - |
| 75 | Culpeper County |
75.09% |
|
35,058人 | 46,689人 | 50.0 | - |
| バージニア州郡の平均 |
75.03% |
- |
40,947人 | 59,709人 | 50.0 | - |
| 76 | Winchester city |
74.54% |
|
19,532人 | 26,203人 | 49.7 | - |
| 77 | Williamsburg city |
73.98% |
|
10,407人 | 14,068人 | 49.4 | - |
| 78 | Amelia County |
73.54% |
|
9,332人 | 12,690人 | 49.1 | - |
| 79 | Henry County |
72.92% |
|
39,487人 | 54,151人 | 48.8 | - |
| 80 | Stafford County |
72.49% |
|
93,483人 | 128,961人 | 48.5 | - |
| 81 | Isle of Wight County |
71.78% |
|
25,318人 | 35,270人 | 48.1 | - |
| 82 | Arlington County |
71.75% |
|
148,970人 | 207,627人 | 48.1 | - |
| 83 | Northumberland County |
71.38% |
|
8,801人 | 12,330人 | 47.9 | - |
| 84 | Lancaster County |
70.13% |
|
7,989人 | 11,391人 | 47.2 | - |
| 85 | Fairfax city |
69.60% |
|
15,706人 | 22,565人 | 46.9 | - |
| 86 | Charlottesville city |
69.08% |
|
30,031人 | 43,475人 | 46.6 | - |
| 87 | Loudoun County |
68.67% |
|
214,471人 | 312,311人 | 46.4 | - |
| 88 | Chesterfield County |
68.29% |
|
215,954人 | 316,236人 | 46.1 | - |
| 89 | Virginia Beach city |
67.73% |
|
296,670人 | 437,994人 | 45.8 | - |
| 90 | Charlotte County |
67.27% |
|
8,467人 | 12,586人 | 45.5 | - |
| 91 | King and Queen County |
67.14% |
|
4,663人 | 6,945人 | 45.5 | - |
| 92 | Westmoreland County |
65.89% |
|
11,501人 | 17,454人 | 44.8 | - |
| 93 | Caroline County |
65.33% |
|
18,649人 | 28,545人 | 44.4 | - |
| 94 | Accomack County |
65.32% |
|
21,662人 | 33,164人 | 44.4 | - |
| 95 | Richmond County |
64.85% |
|
6,001人 | 9,254人 | 44.2 | - |
| 96 | Lynchburg city |
64.41% |
|
48,674人 | 75,568人 | 43.9 | - |
| 97 | Roanoke city |
64.25% |
|
62,343人 | 97,032人 | 43.8 | - |
| 98 | Fredericksburg city |
64.22% |
|
15,596人 | 24,286人 | 43.8 | - |
| 99 | Cumberland County |
63.94% |
|
6,427人 | 10,052人 | 43.6 | - |
| 100 | Dinwiddie County |
63.92% |
|
17,899人 | 28,001人 | 43.6 | - |
| 101 | Prince Edward County |
63.32% |
|
14,796人 | 23,368人 | 43.3 | - |
| 102 | Fairfax County |
62.68% |
|
677,990人 | 1,081,726人 | 42.9 | - |
| 103 | Chesapeake city |
62.56% |
|
139,012人 | 222,209人 | 42.8 | - |
| 104 | Buckingham County |
62.08% |
|
10,644人 | 17,146人 | 42.6 | - |
| 105 | Manassas city |
61.70% |
|
23,336人 | 37,821人 | 42.4 | - |
| 106 | Prince George County |
61.15% |
|
21,845人 | 35,725人 | 42.0 | - |
| 107 | Alexandria city |
60.86% |
|
85,186人 | 139,966人 | 41.9 | - |
| 108 | Lunenburg County |
60.83% |
|
7,856人 | 12,914人 | 41.9 | - |
| 109 | Halifax County |
60.74% |
|
22,011人 | 36,241人 | 41.8 | - |
| 110 | Southampton County |
60.39% |
|
11,215人 | 18,570人 | 41.6 | - |
| 111 | Mecklenburg County |
59.95% |
|
19,619人 | 32,727人 | 41.3 | - |
| 112 | Henrico County |
59.20% |
|
181,719人 | 306,935人 | 40.9 | - |
| 113 | Northampton County |
57.86% |
|
7,168人 | 12,389人 | 40.2 | - |
| 114 | Prince William County |
57.81% |
|
232,401人 | 402,002人 | 40.1 | - |
| 115 | Essex County |
57.12% |
|
6,370人 | 11,151人 | 39.7 | - |
| 116 | Nottoway County |
56.57% |
|
8,968人 | 15,853人 | 39.4 | - |
| 117 | Manassas Park city |
55.94% |
|
7,985人 | 14,273人 | 39.1 | - |
| 118 | Hopewell city |
55.40% |
|
12,515人 | 22,591人 | 38.7 | - |
| 119 | Suffolk city |
52.25% |
|
44,197人 | 84,585人 | 36.9 | - |
| 120 | Surry County |
51.26% |
|
3,618人 | 7,058人 | 36.4 | - |
| 121 | Martinsville city |
49.95% |
|
6,903人 | 13,821人 | 35.6 | - |
| 122 | Newport News city |
48.98% |
|
88,518人 | 180,719人 | 35.1 | - |
| 123 | Danville city |
47.69% |
|
20,531人 | 43,055人 | 34.3 | - |
| 124 | Norfolk city |
47.08% |
|
114,304人 | 242,803人 | 34.0 | - |
| 125 | Hampton city |
42.67% |
|
58,642人 | 137,436人 | 31.4 | - |
| 126 | Portsmouth city |
41.56% |
|
39,701人 | 95,535人 | 30.8 | - |
| 127 | Charles City County |
40.93% |
|
2,970人 | 7,256人 | 30.4 | - |
| 128 | Richmond city |
40.78% |
|
83,288人 | 204,214人 | 30.4 | - |
| 129 | Brunswick County |
40.43% |
|
7,048人 | 17,434人 | 30.2 | - |
| 130 | Franklin city |
39.38% |
|
3,380人 | 8,582人 | 29.6 | - |
| 131 | Sussex County |
39.27% |
|
4,747人 | 12,087人 | 29.5 | - |
| 132 | Greensville County |
38.54% |
|
4,718人 | 12,243人 | 29.1 | - |
| 133 | Emporia city |
32.68% |
|
1,937人 | 5,927人 | 25.7 | - |
| 134 | Petersburg city |
16.09% |
|
5,217人 | 32,420人 | 16.2 | - |
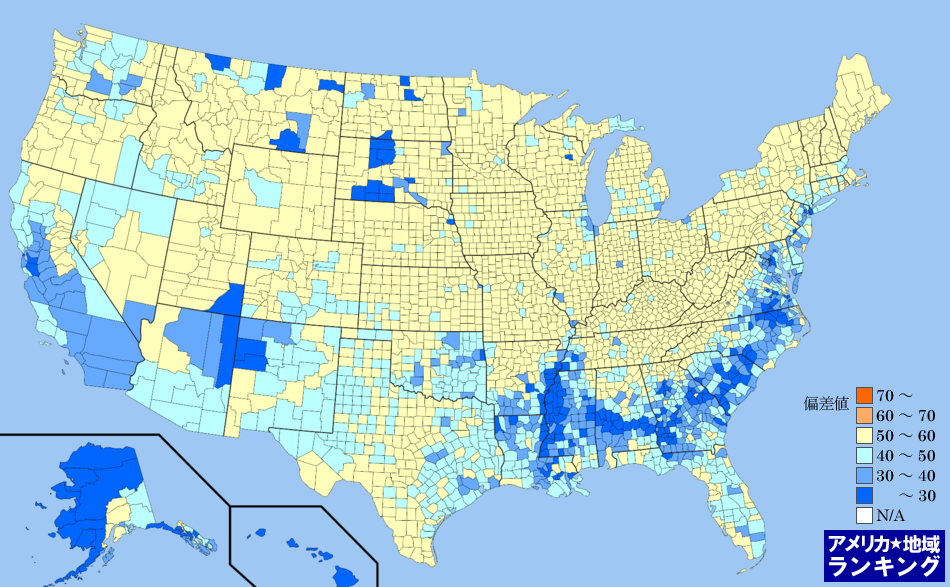
全米・白人比率ランキングマップ(郡別)
白人比率ランキング(郡別)の偏差値にしたがって色分けしたアメリカ合衆国の全郡マップです。アメリカ合衆国におけるすべての郡(州の下の地域区分)の平均と比べて、数値が高い地域はより赤く、数値が低い地域はより青く色分けしています。
アメリカ州のエリアをクリックしてください。その州内における郡のランキングページを表示します。