ノースカロライナ州の人口にしめる移住割合ランキング
| 順位 | 郡 | 人口にしめる移住割合
(2011年7月~翌年6月末) |
移住者数 |
人口 |
偏差値 | 評価 |
|---|
| 1 | Brunswick County |
1.90% |
  |
2,093人 | 110,268人 | 72.7 | - |
| 2 | Wake County |
1.65% |
|
15,341人 | 928,693人 | 69.6 | - |
| 3 | Harnett County |
1.61% |
|
1,915人 | 119,285人 | 69.0 | - |
| 4 | Mecklenburg County |
1.60% |
|
15,127人 | 945,251人 | 68.9 | - |
| 5 | Orange County |
1.46% |
|
1,982人 | 135,418人 | 67.2 | - |
| 6 | Onslow County |
1.44% |
|
2,562人 | 177,430人 | 67.0 | - |
| 7 | Lee County |
1.35% |
|
792人 | 58,605人 | 65.8 | - |
| 8 | Cabarrus County |
1.34% |
|
2,435人 | 181,059人 | 65.7 | - |
| 9 | Durham County |
1.30% |
|
3,545人 | 273,654人 | 65.1 | - |
| 10 | New Hanover County |
1.29% |
|
2,667人 | 205,951人 | 65.1 | - |
| 11 | Moore County |
1.23% |
|
1,101人 | 89,359人 | 64.3 | - |
| 12 | Buncombe County |
1.15% |
|
2,775人 | 241,527人 | 63.3 | - |
| 13 | Pender County |
1.09% |
|
584人 | 53,480人 | 62.6 | - |
| 14 | Chatham County |
1.07% |
|
701人 | 65,280人 | 62.3 | - |
| 15 | Union County |
1.02% |
|
2,084人 | 205,193人 | 61.6 | - |
| 16 | Henderson County |
0.83% |
|
896人 | 107,565人 | 59.3 | - |
| 17 | Iredell County |
0.81% |
|
1,311人 | 161,005人 | 59.1 | - |
| 18 | Perquimans County |
0.79% |
|
106人 | 13,458人 | 58.7 | - |
| 19 | Swain County |
0.77% |
|
108人 | 14,033人 | 58.5 | - |
| 20 | Guilford County |
0.73% |
|
3,603人 | 495,335人 | 58.0 | - |
| 21 | Carteret County |
0.64% |
|
433人 | 67,354人 | 56.9 | - |
| 22 | Hoke County |
0.62% |
|
306人 | 49,507人 | 56.6 | - |
| 23 | Dare County |
0.61% |
|
210人 | 34,283人 | 56.6 | - |
| 24 | Johnston County |
0.61% |
|
1,054人 | 172,814人 | 56.5 | - |
| 25 | Forsyth County |
0.57% |
|
2,028人 | 354,454人 | 56.0 | - |
| 26 | Mitchell County |
0.55% |
|
85人 | 15,375人 | 55.8 | - |
| 27 | Alamance County |
0.54% |
|
832人 | 152,801人 | 55.7 | - |
| 28 | Haywood County |
0.54% |
|
316人 | 58,732人 | 55.6 | - |
| 29 | Polk County |
0.54% |
|
109人 | 20,298人 | 55.6 | - |
| 30 | Pitt County |
0.49% |
|
833人 | 170,715人 | 55.0 | - |
| 31 | Currituck County |
0.46% |
|
111人 | 23,947人 | 54.7 | - |
| 32 | Lincoln County |
0.46% |
|
364人 | 78,831人 | 54.7 | - |
| 33 | Clay County |
0.45% |
|
48人 | 10,657人 | 54.5 | - |
| 34 | Granville County |
0.45% |
|
269人 | 60,114人 | 54.5 | - |
| 35 | Watauga County |
0.42% |
|
219人 | 51,662人 | 54.2 | - |
| 36 | Transylvania County |
0.34% |
|
111人 | 32,815人 | 53.1 | - |
| 37 | Gaston County |
0.33% |
|
689人 | 206,918人 | 53.1 | - |
| 38 | Franklin County |
0.32% |
|
193人 | 61,181人 | 52.8 | - |
| 39 | Jones County |
0.30% |
|
31人 | 10,246人 | 52.7 | - |
| 40 | Wilson County |
0.27% |
|
223人 | 81,479人 | 52.3 | - |
| 41 | Macon County |
0.27% |
|
91人 | 33,851人 | 52.2 | - |
| 42 | Pasquotank County |
0.27% |
|
108人 | 40,355人 | 52.2 | - |
| 43 | Duplin County |
0.24% |
|
145人 | 59,596人 | 51.9 | - |
| 44 | Wilkes County |
0.22% |
|
149人 | 69,225人 | 51.6 | - |
| 45 | Ashe County |
0.20% |
|
54人 | 27,139人 | 51.4 | - |
| 46 | Stanly County |
0.20% |
|
118人 | 60,428人 | 51.3 | - |
| 47 | Hyde County |
0.19% |
|
11人 | 5,848人 | 51.2 | - |
| 48 | Randolph County |
0.16% |
|
227人 | 142,041人 | 50.9 | - |
| 49 | Sampson County |
0.13% |
|
84人 | 63,636人 | 50.5 | - |
| 50 | McDowell County |
0.13% |
|
57人 | 44,949人 | 50.5 | - |
| 51 | Catawba County |
0.12% |
|
184人 | 153,958人 | 50.4 | - |
| 52 | Jackson County |
0.10% |
|
40人 | 40,283人 | 50.1 | - |
| ノースカロライナ州郡の平均 |
0.09% |
- |
601人 | 96,511人 | 50.0 | - |
| 53 | Rutherford County |
0.02% |
|
11人 | 67,425人 | 49.1 | - |
| 54 | Davidson County |
0.01% |
|
14人 | 163,077人 | 49.0 | - |
| 55 | Wayne County |
-0.00% |
|
-4人 | 123,839人 | 48.8 | - |
| 56 | Surry County |
-0.03% |
- |
-25人 | 73,601人 | 48.5 | - |
| 57 | Bladen County |
-0.04% |
- |
-14人 | 34,994人 | 48.4 | - |
| 58 | Cherokee County |
-0.05% |
- |
-13人 | 27,166人 | 48.3 | - |
| 59 | Rowan County |
-0.05% |
- |
-75人 | 138,118人 | 48.2 | - |
| 60 | Camden County |
-0.09% |
- |
-9人 | 10,053人 | 47.8 | - |
| 61 | Cleveland County |
-0.10% |
- |
-100人 | 97,581人 | 47.6 | - |
| 62 | Davie County |
-0.11% |
- |
-46人 | 41,390人 | 47.5 | - |
| 63 | Robeson County |
-0.16% |
- |
-215人 | 134,976人 | 46.9 | - |
| 64 | Yancey County |
-0.19% |
- |
-33人 | 17,704人 | 46.5 | - |
| 65 | Madison County |
-0.22% |
- |
-45人 | 20,833人 | 46.2 | - |
| 66 | Lenoir County |
-0.25% |
- |
-149人 | 59,410人 | 45.7 | - |
| 67 | Beaufort County |
-0.26% |
- |
-124人 | 47,655人 | 45.6 | - |
| 68 | Richmond County |
-0.26% |
- |
-123人 | 46,683人 | 45.6 | - |
| 69 | Hertford County |
-0.31% |
- |
-75人 | 24,529人 | 45.1 | - |
| 70 | Caldwell County |
-0.32% |
- |
-262人 | 82,259人 | 44.9 | - |
| 71 | Rockingham County |
-0.32% |
- |
-299人 | 93,155人 | 44.9 | - |
| 72 | Columbus County |
-0.34% |
- |
-198人 | 57,831人 | 44.6 | - |
| 73 | Edgecombe County |
-0.36% |
- |
-204人 | 56,082人 | 44.3 | - |
| 74 | Burke County |
-0.38% |
- |
-341人 | 90,861人 | 44.2 | - |
| 75 | Halifax County |
-0.40% |
- |
-217人 | 54,316人 | 43.9 | - |
| 76 | Avery County |
-0.40% |
- |
-71人 | 17,758人 | 43.9 | - |
| 77 | Vance County |
-0.44% |
- |
-198人 | 45,223人 | 43.4 | - |
| 78 | Nash County |
-0.45% |
- |
-429人 | 95,912人 | 43.3 | - |
| 79 | Craven County |
-0.47% |
- |
-488人 | 104,514人 | 43.0 | - |
| 80 | Yadkin County |
-0.48% |
- |
-182人 | 38,268人 | 42.9 | - |
| 81 | Chowan County |
-0.48% |
- |
-71人 | 14,851人 | 42.9 | - |
| 82 | Alleghany County |
-0.48% |
- |
-53人 | 11,013人 | 42.9 | - |
| 83 | Anson County |
-0.54% |
- |
-143人 | 26,512人 | 42.1 | - |
| 84 | Alexander County |
-0.66% |
- |
-245人 | 37,092人 | 40.6 | - |
| 85 | Graham County |
-0.67% |
- |
-59人 | 8,771人 | 40.5 | - |
| 86 | Stokes County |
-0.71% |
- |
-337人 | 47,204人 | 39.9 | - |
| 87 | Person County |
-0.75% |
- |
-295人 | 39,548人 | 39.5 | - |
| 88 | Montgomery County |
-0.95% |
- |
-264人 | 27,869人 | 37.0 | - |
| 89 | Scotland County |
-0.96% |
- |
-349人 | 36,356人 | 36.9 | - |
| 90 | Tyrrell County |
-0.98% |
- |
-43人 | 4,371人 | 36.6 | - |
| 91 | Cumberland County |
-0.99% |
- |
-3,189人 | 323,281人 | 36.5 | - |
| 92 | Martin County |
-1.12% |
- |
-271人 | 24,257人 | 34.9 | - |
| 93 | Bertie County |
-1.16% |
- |
-244人 | 20,953人 | 34.3 | - |
| 94 | Caswell County |
-1.24% |
- |
-293人 | 23,555人 | 33.3 | - |
| 95 | Greene County |
-1.25% |
- |
-271人 | 21,656人 | 33.2 | - |
| 96 | Warren County |
-1.30% |
- |
-271人 | 20,915人 | 32.7 | - |
| 97 | Pamlico County |
-1.37% |
- |
-182人 | 13,315人 | 31.8 | - |
| 98 | Gates County |
-1.37% |
- |
-166人 | 12,073人 | 31.7 | - |
| 99 | Washington County |
-1.64% |
- |
-213人 | 12,960人 | 28.3 | - |
| 100 | Northampton County |
-2.19% |
- |
-481人 | 21,997人 | 21.5 | - |
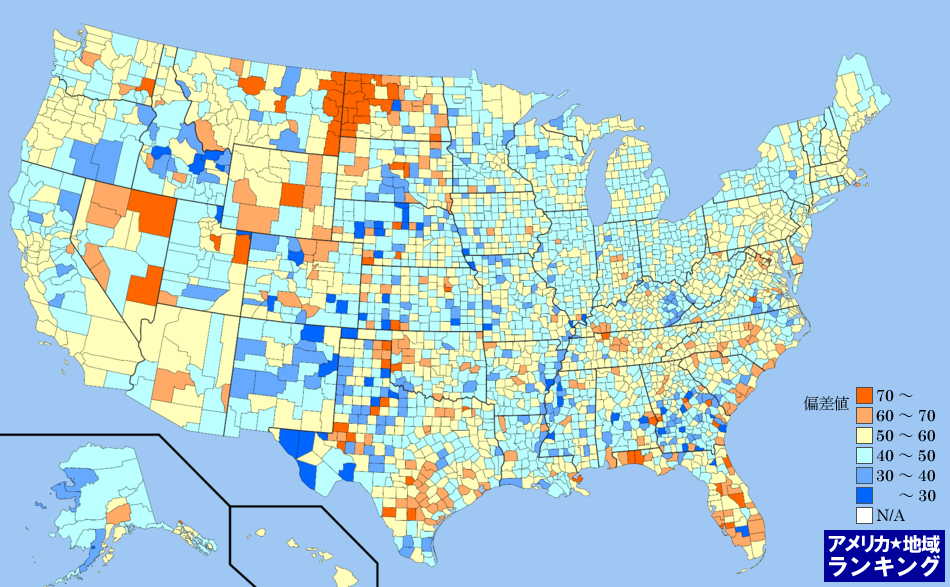
全米・人口にしめる移住割合(2011年7月~翌年6月末)ランキングマップ(郡別)
人口にしめる移住割合(2011年7月~翌年6月末)ランキング(郡別)の偏差値にしたがって色分けしたアメリカ合衆国の全郡マップです。アメリカ合衆国におけるすべての郡(州の下の地域区分)の平均と比べて、数値が高い地域はより赤く、数値が低い地域はより青く色分けしています。
アメリカ州のエリアをクリックしてください。その州内における郡のランキングページを表示します。