バージニア州の人口にしめる外国からの移住割合ランキング
| 順位 | 郡 | 人口にしめる外国からの移住割合
(2010年7月~翌年6月末) |
外国からの移住 |
人口 |
偏差値 | 評価 |
|---|
| 1 | Alexandria city |
0.98% |
  |
1,382人 | 140,810人 | 90.7 | - |
| 2 | Manassas city |
0.84% |
|
323人 | 38,277人 | 84.1 | - |
| 3 | Arlington County |
0.84% |
|
1,754人 | 209,281人 | 83.8 | - |
| 4 | Fairfax County |
0.79% |
|
8,551人 | 1,086,590人 | 81.3 | - |
| 5 | Falls Church city |
0.76% |
|
95人 | 12,490人 | 80.1 | - |
| 6 | Fairfax city |
0.74% |
|
168人 | 22,629人 | 79.2 | - |
| 7 | Charlottesville city |
0.73% |
|
318人 | 43,574人 | 78.6 | - |
| 8 | Manassas Park city |
0.64% |
|
93人 | 14,419人 | 74.5 | - |
| 9 | Harrisonburg city |
0.59% |
|
289人 | 49,044人 | 71.8 | - |
| 10 | Loudoun County |
0.54% |
|
1,706人 | 315,450人 | 69.5 | - |
| 11 | Fredericksburg city |
0.49% |
|
120人 | 24,441人 | 67.1 | - |
| 12 | Prince William County |
0.46% |
|
1,851人 | 406,517人 | 65.4 | - |
| 13 | Williamsburg city |
0.45% |
|
64人 | 14,137人 | 65.3 | - |
| 14 | Radford city |
0.41% |
|
68人 | 16,434人 | 63.4 | - |
| 15 | Montgomery County |
0.40% |
|
374人 | 94,580人 | 62.5 | - |
| 16 | Henrico County |
0.39% |
|
1,190人 | 307,504人 | 62.1 | - |
| 17 | Albemarle County |
0.37% |
|
364人 | 99,182人 | 61.2 | - |
| 18 | Richmond city |
0.35% |
|
722人 | 204,359人 | 60.5 | - |
| 19 | Northampton County |
0.32% |
|
40人 | 12,366人 | 59.1 | - |
| 20 | Lynchburg city |
0.29% |
|
221人 | 75,741人 | 57.5 | - |
| 21 | Newport News city |
0.27% |
|
489人 | 180,941人 | 56.5 | - |
| 22 | Norfolk city |
0.26% |
|
641人 | 242,962人 | 56.2 | - |
| 23 | Virginia Beach city |
0.26% |
|
1,146人 | 439,251人 | 56.1 | - |
| 24 | Winchester city |
0.23% |
|
60人 | 26,236人 | 54.5 | - |
| 25 | Roanoke city |
0.22% |
|
213人 | 96,778人 | 54.1 | - |
| 26 | James City County |
0.21% |
|
144人 | 67,319人 | 53.8 | - |
| 27 | York County |
0.21% |
|
135人 | 65,171人 | 53.5 | - |
| 28 | Accomack County |
0.20% |
|
65人 | 33,195人 | 52.9 | - |
| 29 | Roanoke County |
0.17% |
|
159人 | 92,445人 | 51.8 | - |
| 30 | Chesterfield County |
0.17% |
|
540人 | 317,210人 | 51.7 | - |
| 31 | Shenandoah County |
0.16% |
|
66人 | 42,065人 | 51.1 | - |
| 32 | Lexington city |
0.16% |
|
11人 | 7,058人 | 51.0 | - |
| 33 | Culpeper County |
0.15% |
|
70人 | 46,857人 | 50.7 | - |
| 34 | Stafford County |
0.15% |
|
190人 | 129,858人 | 50.6 | - |
| 35 | Lancaster County |
0.14% |
|
16人 | 11,373人 | 50.3 | - |
| 36 | Hampton city |
0.14% |
|
192人 | 137,455人 | 50.2 | - |
| 37 | Petersburg city |
0.14% |
|
45人 | 32,584人 | 50.2 | - |
| バージニア州郡の平均 |
0.13% |
- |
189人 | 59,889人 | 50.0 | - |
| 38 | Henry County |
0.13% |
|
71人 | 54,108人 | 49.8 | - |
| 39 | Richmond County |
0.13% |
|
12人 | 9,281人 | 49.7 | - |
| 40 | Orange County |
0.13% |
|
42人 | 33,553人 | 49.5 | - |
| 41 | Mecklenburg County |
0.12% |
|
39人 | 32,672人 | 49.3 | - |
| 42 | Chesapeake city |
0.12% |
|
261人 | 223,614人 | 49.1 | - |
| 43 | New Kent County |
0.11% |
|
21人 | 18,563人 | 49.0 | - |
| 44 | Amelia County |
0.11% |
|
14人 | 12,725人 | 48.8 | - |
| 45 | Salem city |
0.10% |
|
26人 | 24,857人 | 48.6 | - |
| 46 | Prince George County |
0.10% |
|
37人 | 35,589人 | 48.5 | - |
| 47 | Spotsylvania County |
0.10% |
|
124人 | 122,874人 | 48.4 | - |
| 48 | Hopewell city |
0.10% |
|
22人 | 22,636人 | 48.2 | - |
| 49 | Campbell County |
0.09% |
|
52人 | 54,897人 | 48.1 | - |
| 50 | Lunenburg County |
0.09% |
|
12人 | 12,906人 | 48.0 | - |
| 51 | Caroline County |
0.09% |
|
26人 | 28,621人 | 47.9 | - |
| 52 | Staunton city |
0.09% |
|
21人 | 23,834人 | 47.8 | - |
| 53 | Prince Edward County |
0.09% |
|
20人 | 23,349人 | 47.6 | - |
| 54 | Warren County |
0.09% |
|
32人 | 37,535人 | 47.6 | - |
| 55 | Poquoson city |
0.07% |
|
9人 | 12,150人 | 47.1 | - |
| 56 | Alleghany County |
0.07% |
|
12人 | 16,218人 | 47.1 | - |
| 57 | Clarke County |
0.07% |
|
10人 | 14,052人 | 46.9 | - |
| 58 | Rockingham County |
0.07% |
|
54人 | 76,349人 | 46.9 | - |
| 59 | Patrick County |
0.07% |
|
13人 | 18,478人 | 46.9 | - |
| 60 | Colonial Heights city |
0.07% |
|
12人 | 17,382人 | 46.8 | - |
| 61 | Waynesboro city |
0.07% |
|
14人 | 21,051人 | 46.7 | - |
| 62 | Martinsville city |
0.07% |
|
9人 | 13,715人 | 46.7 | - |
| 63 | Nottoway County |
0.06% |
|
10人 | 15,878人 | 46.6 | - |
| 64 | King and Queen County |
0.06% |
|
4人 | 6,961人 | 46.3 | - |
| 65 | Westmoreland County |
0.06% |
|
10人 | 17,440人 | 46.3 | - |
| 66 | Northumberland County |
0.06% |
|
7人 | 12,334人 | 46.3 | - |
| 67 | King William County |
0.06% |
|
9人 | 15,977人 | 46.2 | - |
| 68 | Portsmouth city |
0.05% |
|
50人 | 95,505人 | 46.0 | - |
| 69 | Bedford County |
0.05% |
|
34人 | 68,752人 | 45.9 | - |
| 70 | Fauquier County |
0.05% |
|
31人 | 65,381人 | 45.8 | - |
| 71 | Pittsylvania County |
0.05% |
|
30人 | 63,661人 | 45.8 | - |
| 72 | Mathews County |
0.04% |
|
4人 | 8,962人 | 45.7 | - |
| 73 | Hanover County |
0.04% |
|
43人 | 99,922人 | 45.6 | - |
| 74 | Botetourt County |
0.04% |
|
14人 | 33,171人 | 45.6 | - |
| 75 | Franklin County |
0.04% |
|
23人 | 56,221人 | 45.5 | - |
| 76 | Floyd County |
0.04% |
|
6人 | 15,325人 | 45.4 | - |
| 77 | Gloucester County |
0.04% |
|
14人 | 36,921人 | 45.4 | - |
| 78 | Suffolk city |
0.04% |
|
32人 | 84,895人 | 45.3 | - |
| 79 | Goochland County |
0.04% |
|
8人 | 21,788人 | 45.3 | - |
| 80 | Danville city |
0.03% |
|
15人 | 42,885人 | 45.2 | - |
| 81 | Scott County |
0.03% |
|
8人 | 23,111人 | 45.2 | - |
| 82 | Tazewell County |
0.03% |
|
15人 | 45,178人 | 45.1 | - |
| 83 | Dinwiddie County |
0.03% |
|
9人 | 27,998人 | 45.1 | - |
| 84 | Frederick County |
0.03% |
|
24人 | 78,529人 | 45.0 | - |
| 85 | Louisa County |
0.03% |
|
10人 | 33,261人 | 45.0 | - |
| 86 | Giles County |
0.03% |
|
5人 | 17,292人 | 44.9 | - |
| 87 | Amherst County |
0.03% |
|
9人 | 32,052人 | 44.9 | - |
| 88 | Rappahannock County |
0.03% |
|
2人 | 7,502人 | 44.8 | - |
| 89 | Greene County |
0.02% |
|
4人 | 18,457人 | 44.6 | - |
| 90 | Nelson County |
0.02% |
|
3人 | 14,992人 | 44.5 | - |
| 91 | Augusta County |
0.02% |
|
13人 | 73,490人 | 44.4 | - |
| 92 | Isle of Wight County |
0.02% |
|
6人 | 35,296人 | 44.3 | - |
| 93 | Covington city |
0.02% |
|
1人 | 5,953人 | 44.3 | - |
| 94 | Carroll County |
0.02% |
|
5人 | 30,019人 | 44.3 | - |
| 95 | Greensville County |
0.02% |
|
2人 | 12,233人 | 44.3 | - |
| 96 | Southampton County |
0.02% |
|
3人 | 18,592人 | 44.3 | - |
| 97 | Bedford city |
0.02% |
|
1人 | 6,225人 | 44.3 | - |
| 98 | Bland County |
0.01% |
|
1人 | 6,816人 | 44.2 | - |
| 99 | Page County |
0.01% |
|
3人 | 24,030人 | 44.1 | - |
| 100 | Lee County |
0.01% |
|
3人 | 25,517人 | 44.1 | - |
| 101 | Halifax County |
0.01% |
|
4人 | 36,155人 | 44.1 | - |
| 102 | Washington County |
0.01% |
|
6人 | 54,879人 | 44.1 | - |
| 103 | King George County |
0.01% |
|
2人 | 23,646人 | 43.9 | - |
| 104 | Sussex County |
0.01% |
|
1人 | 11,992人 | 43.9 | - |
| 105 | Charlotte County |
0.01% |
|
1人 | 12,568人 | 43.9 | - |
| 106 | Madison County |
0.01% |
|
1人 | 13,289人 | 43.9 | - |
| 107 | Wise County |
0.00% |
|
2人 | 41,574人 | 43.8 | - |
| 108 | Rockbridge County |
0.00% |
|
1人 | 22,269人 | 43.7 | - |
| 109 | Fluvanna County |
0.00% |
|
1人 | 25,762人 | 43.7 | - |
| 110 | Buckingham County |
0.00% |
|
0人 | 17,127人 | 43.5 | - |
| 110 | Essex County |
0.00% |
|
0人 | 11,166人 | 43.5 | - |
| 110 | Emporia city |
0.00% |
|
0人 | 5,924人 | 43.5 | - |
| 110 | Norton city |
0.00% |
|
0人 | 3,978人 | 43.5 | - |
| 110 | Powhatan County |
0.00% |
|
0人 | 28,062人 | 43.5 | - |
| 110 | Charles City County |
0.00% |
|
0人 | 7,268人 | 43.5 | - |
| 110 | Highland County |
0.00% |
|
0人 | 2,295人 | 43.5 | - |
| 110 | Dickenson County |
0.00% |
|
0人 | 15,908人 | 43.5 | - |
| 110 | Craig County |
0.00% |
|
0人 | 5,188人 | 43.5 | - |
| 110 | Middlesex County |
0.00% |
|
0人 | 10,950人 | 43.5 | - |
| 120 | Pulaski County |
-0.00% |
|
-1人 | 34,803人 | 43.4 | - |
| 121 | Smyth County |
-0.00% |
|
-1人 | 32,173人 | 43.4 | - |
| 122 | Brunswick County |
-0.01% |
- |
-1人 | 17,421人 | 43.3 | - |
| 123 | Appomattox County |
-0.01% |
- |
-1人 | 15,022人 | 43.2 | - |
| 124 | Franklin city |
-0.01% |
- |
-1人 | 8,613人 | 43.0 | - |
| 125 | Grayson County |
-0.01% |
- |
-2人 | 15,478人 | 42.9 | - |
| 126 | Wythe County |
-0.01% |
- |
-4人 | 29,225人 | 42.9 | - |
| 127 | Russell County |
-0.01% |
- |
-4人 | 28,862人 | 42.9 | - |
| 128 | Surry County |
-0.01% |
- |
-1人 | 7,052人 | 42.9 | - |
| 129 | Buena Vista city |
-0.02% |
- |
-1人 | 6,637人 | 42.8 | - |
| 130 | Buchanan County |
-0.02% |
- |
-4人 | 24,023人 | 42.7 | - |
| 131 | Cumberland County |
-0.02% |
- |
-2人 | 10,041人 | 42.6 | - |
| 132 | Bath County |
-0.02% |
- |
-1人 | 4,718人 | 42.5 | - |
| 133 | Bristol city |
-0.05% |
- |
-9人 | 17,849人 | 41.1 | - |
| 134 | Galax city |
-0.07% |
- |
-5人 | 7,074人 | 40.1 | - |
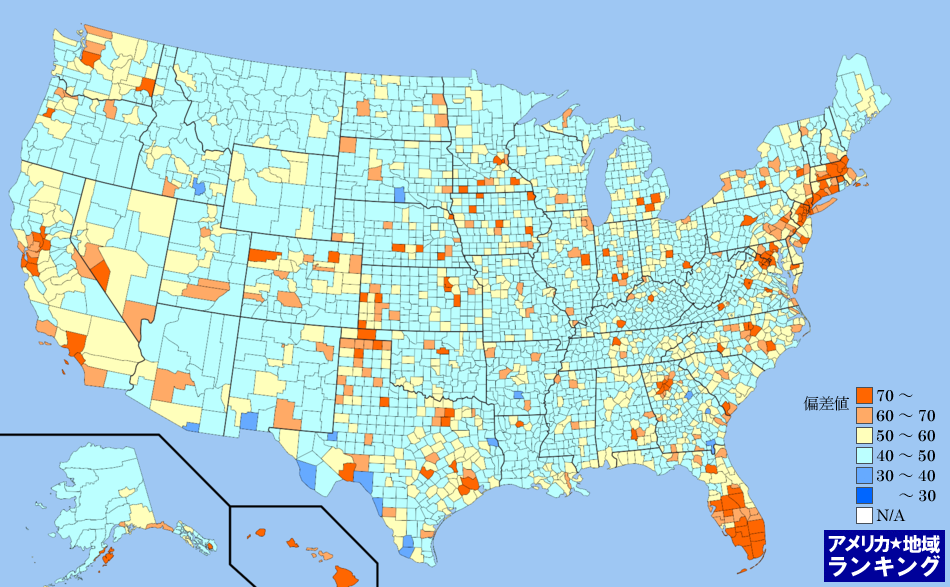
全米・人口にしめる外国からの移住割合(2010年7月~翌年6月末)ランキングマップ(郡別)
人口にしめる外国からの移住割合(2010年7月~翌年6月末)ランキング(郡別)の偏差値にしたがって色分けしたアメリカ合衆国の全郡マップです。アメリカ合衆国におけるすべての郡(州の下の地域区分)の平均と比べて、数値が高い地域はより赤く、数値が低い地域はより青く色分けしています。
アメリカ州のエリアをクリックしてください。その州内における郡のランキングページを表示します。