ケンタッキー州の人口にしめる外国からの移住割合ランキング
| 順位 | 郡 | 人口にしめる外国からの移住割合
(2010年7月~翌年6月末) |
外国からの移住 |
人口 |
偏差値 | 評価 |
|---|
| 1 | Warren County |
0.40% |
  |
458人 | 114,157人 | 99.7 | - |
| 2 | Fayette County |
0.40% |
|
1,178人 | 296,715人 | 99.1 | - |
| 3 | Boone County |
0.28% |
|
330人 | 119,306人 | 82.5 | - |
| 4 | Jefferson County |
0.23% |
|
1,682人 | 742,324人 | 75.5 | - |
| 5 | Marion County |
0.20% |
|
40人 | 19,803人 | 72.1 | - |
| 6 | Trimble County |
0.19% |
|
17人 | 8,787人 | 70.9 | - |
| 7 | Christian County |
0.19% |
|
143人 | 74,138人 | 70.9 | - |
| 8 | Butler County |
0.17% |
|
21人 | 12,708人 | 67.0 | - |
| 9 | Jessamine County |
0.16% |
|
76人 | 48,720人 | 65.8 | - |
| 10 | Calloway County |
0.16% |
|
58人 | 37,278人 | 65.7 | - |
| 11 | Franklin County |
0.14% |
|
71人 | 49,280人 | 64.1 | - |
| 12 | Graves County |
0.14% |
|
52人 | 37,185人 | 63.5 | - |
| 13 | Bourbon County |
0.12% |
|
24人 | 19,972人 | 60.8 | - |
| 14 | Shelby County |
0.12% |
|
49人 | 42,287人 | 60.2 | - |
| 15 | Gallatin County |
0.10% |
|
9人 | 8,587人 | 58.7 | - |
| 16 | Kenton County |
0.10% |
|
160人 | 159,880人 | 58.0 | - |
| 17 | Fleming County |
0.09% |
|
13人 | 14,391人 | 56.7 | - |
| 18 | Todd County |
0.08% |
|
10人 | 12,427人 | 55.3 | - |
| 19 | Hardin County |
0.08% |
|
86人 | 107,021人 | 55.3 | - |
| 20 | Meade County |
0.08% |
|
23人 | 28,695人 | 55.3 | - |
| 21 | Woodford County |
0.08% |
|
19人 | 25,004人 | 54.7 | - |
| 22 | Russell County |
0.07% |
|
13人 | 17,543人 | 54.4 | - |
| 23 | Webster County |
0.07% |
|
10人 | 13,605人 | 54.3 | - |
| 24 | Clinton County |
0.07% |
|
7人 | 10,282人 | 53.6 | - |
| 25 | Pulaski County |
0.06% |
|
40人 | 63,192人 | 52.9 | - |
| 26 | Ballard County |
0.06% |
|
5人 | 8,255人 | 52.5 | - |
| 27 | Madison County |
0.06% |
|
50人 | 83,143人 | 52.5 | - |
| 28 | Oldham County |
0.06% |
|
34人 | 60,420人 | 51.9 | - |
| 29 | Knott County |
0.06% |
|
9人 | 16,307人 | 51.8 | - |
| 30 | Crittenden County |
0.05% |
|
5人 | 9,311人 | 51.6 | - |
| 31 | Henry County |
0.05% |
|
8人 | 15,398人 | 51.4 | - |
| 32 | Casey County |
0.05% |
|
8人 | 15,949人 | 51.1 | - |
| 33 | Allen County |
0.05% |
|
10人 | 20,024人 | 51.1 | - |
| 34 | Metcalfe County |
0.05% |
|
5人 | 10,107人 | 51.0 | - |
| 35 | Larue County |
0.05% |
|
7人 | 14,206人 | 51.0 | - |
| 36 | Scott County |
0.05% |
|
22人 | 47,437人 | 50.6 | - |
| 37 | Bath County |
0.04% |
|
5人 | 11,612人 | 50.1 | - |
| ケンタッキー州郡の平均 |
0.04% |
- |
41人 | 36,222人 | 50.0 | - |
| 38 | Daviess County |
0.04% |
|
40人 | 96,736人 | 49.9 | - |
| 39 | Powell County |
0.04% |
|
5人 | 12,642人 | 49.6 | - |
| 40 | Clark County |
0.04% |
|
13人 | 35,620人 | 49.2 | - |
| 41 | Boyle County |
0.04% |
|
10人 | 28,451人 | 49.0 | - |
| 42 | Knox County |
0.03% |
|
11人 | 31,868人 | 48.9 | - |
| 43 | Nelson County |
0.03% |
|
15人 | 43,594人 | 48.9 | - |
| 44 | Estill County |
0.03% |
|
5人 | 14,685人 | 48.9 | - |
| 45 | Greenup County |
0.03% |
|
12人 | 36,910人 | 48.7 | - |
| 46 | Barren County |
0.03% |
|
13人 | 42,150人 | 48.4 | - |
| 47 | Montgomery County |
0.03% |
|
8人 | 26,541人 | 48.3 | - |
| 48 | Simpson County |
0.03% |
|
5人 | 17,352人 | 48.1 | - |
| 49 | Letcher County |
0.03% |
|
7人 | 24,570人 | 48.1 | - |
| 50 | Monroe County |
0.03% |
|
3人 | 10,957人 | 47.9 | - |
| 51 | Marshall County |
0.03% |
|
8人 | 31,473人 | 47.7 | - |
| 52 | Whitley County |
0.03% |
|
9人 | 35,663人 | 47.7 | - |
| 53 | Bracken County |
0.02% |
|
2人 | 8,489人 | 47.4 | - |
| 54 | Hopkins County |
0.02% |
|
11人 | 46,881人 | 47.4 | - |
| 55 | Campbell County |
0.02% |
|
21人 | 90,522人 | 47.4 | - |
| 56 | Caldwell County |
0.02% |
|
3人 | 12,976人 | 47.4 | - |
| 57 | Jackson County |
0.02% |
|
3人 | 13,507人 | 47.2 | - |
| 58 | Bell County |
0.02% |
|
6人 | 28,701人 | 47.1 | - |
| 59 | Union County |
0.02% |
|
3人 | 15,029人 | 46.9 | - |
| 60 | Lawrence County |
0.02% |
|
3人 | 15,896人 | 46.8 | - |
| 61 | Carroll County |
0.02% |
|
2人 | 10,798人 | 46.7 | - |
| 62 | Washington County |
0.02% |
|
2人 | 11,760人 | 46.5 | - |
| 63 | Muhlenberg County |
0.02% |
|
5人 | 31,488人 | 46.4 | - |
| 64 | Nicholas County |
0.01% |
|
1人 | 7,115人 | 46.1 | - |
| 65 | Floyd County |
0.01% |
|
5人 | 39,435人 | 45.9 | - |
| 66 | Lyon County |
0.01% |
|
1人 | 8,308人 | 45.8 | - |
| 67 | Spencer County |
0.01% |
|
2人 | 17,114人 | 45.8 | - |
| 68 | Logan County |
0.01% |
|
3人 | 26,833人 | 45.7 | - |
| 69 | Perry County |
0.01% |
|
3人 | 28,711人 | 45.6 | - |
| 70 | Laurel County |
0.01% |
|
6人 | 58,974人 | 45.6 | - |
| 71 | Owen County |
0.01% |
|
1人 | 10,830人 | 45.4 | - |
| 72 | Pike County |
0.01% |
|
6人 | 64,993人 | 45.4 | - |
| 73 | Green County |
0.01% |
|
1人 | 11,230人 | 45.4 | - |
| 74 | Henderson County |
0.01% |
|
4人 | 46,273人 | 45.4 | - |
| 75 | Morgan County |
0.01% |
|
1人 | 13,933人 | 45.2 | - |
| 76 | Trigg County |
0.01% |
|
1人 | 14,355人 | 45.1 | - |
| 77 | Harlan County |
0.01% |
|
2人 | 29,242人 | 45.1 | - |
| 78 | Anderson County |
0.00% |
|
1人 | 21,461人 | 44.8 | - |
| 79 | Ohio County |
0.00% |
|
1人 | 23,851人 | 44.7 | - |
| 80 | Bullitt County |
0.00% |
|
1人 | 74,490人 | 44.3 | - |
| 81 | Leslie County |
0.00% |
|
0人 | 11,293人 | 44.2 | - |
| 81 | Edmonson County |
0.00% |
|
0人 | 12,154人 | 44.2 | - |
| 81 | Owsley County |
0.00% |
|
0人 | 4,776人 | 44.2 | - |
| 81 | Grant County |
0.00% |
|
0人 | 24,675人 | 44.2 | - |
| 81 | Fulton County |
0.00% |
|
0人 | 6,819人 | 44.2 | - |
| 81 | Livingston County |
0.00% |
|
0人 | 9,537人 | 44.2 | - |
| 81 | Rockcastle County |
0.00% |
|
0人 | 17,056人 | 44.2 | - |
| 81 | Menifee County |
0.00% |
|
0人 | 6,313人 | 44.2 | - |
| 81 | Elliott County |
0.00% |
|
0人 | 7,884人 | 44.2 | - |
| 81 | Pendleton County |
0.00% |
|
0人 | 14,907人 | 44.2 | - |
| 81 | Breathitt County |
0.00% |
|
0人 | 13,866人 | 44.2 | - |
| 81 | Cumberland County |
0.00% |
|
0人 | 6,851人 | 44.2 | - |
| 81 | Taylor County |
0.00% |
|
0人 | 24,563人 | 44.2 | - |
| 81 | Johnson County |
0.00% |
|
0人 | 23,405人 | 44.2 | - |
| 81 | McCreary County |
0.00% |
|
0人 | 18,324人 | 44.2 | - |
| 81 | Wolfe County |
0.00% |
|
0人 | 7,338人 | 44.2 | - |
| 81 | Carlisle County |
0.00% |
|
0人 | 5,102人 | 44.2 | - |
| 81 | Mercer County |
0.00% |
|
0人 | 21,346人 | 44.2 | - |
| 81 | Wayne County |
0.00% |
|
0人 | 20,818人 | 44.2 | - |
| 81 | Harrison County |
0.00% |
|
0人 | 18,818人 | 44.2 | - |
| 81 | Lee County |
0.00% |
|
0人 | 7,869人 | 44.2 | - |
| 81 | Mason County |
0.00% |
|
0人 | 17,490人 | 44.2 | - |
| 81 | Breckinridge County |
0.00% |
|
0人 | 20,063人 | 44.2 | - |
| 81 | Hancock County |
0.00% |
|
0人 | 8,554人 | 44.2 | - |
| 81 | McLean County |
0.00% |
|
0人 | 9,516人 | 44.2 | - |
| 81 | Hickman County |
0.00% |
|
0人 | 4,877人 | 44.2 | - |
| 81 | Lincoln County |
0.00% |
|
0人 | 24,750人 | 44.2 | - |
| 81 | Robertson County |
0.00% |
|
0人 | 2,265人 | 44.2 | - |
| 109 | Boyd County |
-0.00% |
- |
-2人 | 49,635人 | 43.6 | - |
| 110 | Garrard County |
-0.01% |
- |
-1人 | 16,924人 | 43.3 | - |
| 111 | Clay County |
-0.01% |
- |
-2人 | 21,731人 | 42.9 | - |
| 112 | Adair County |
-0.01% |
- |
-2人 | 18,613人 | 42.7 | - |
| 113 | Hart County |
-0.01% |
- |
-2人 | 18,208人 | 42.6 | - |
| 114 | Grayson County |
-0.01% |
- |
-3人 | 25,805人 | 42.5 | - |
| 115 | Carter County |
-0.01% |
- |
-4人 | 27,716人 | 42.2 | - |
| 116 | Martin County |
-0.02% |
- |
-2人 | 12,890人 | 42.0 | - |
| 117 | McCracken County |
-0.02% |
- |
-14人 | 65,531人 | 41.2 | - |
| 118 | Lewis County |
-0.02% |
- |
-3人 | 13,844人 | 41.2 | - |
| 119 | Magoffin County |
-0.04% |
- |
-5人 | 13,316人 | 39.0 | - |
| 120 | Rowan County |
-0.04% |
- |
-9人 | 23,350人 | 38.8 | - |
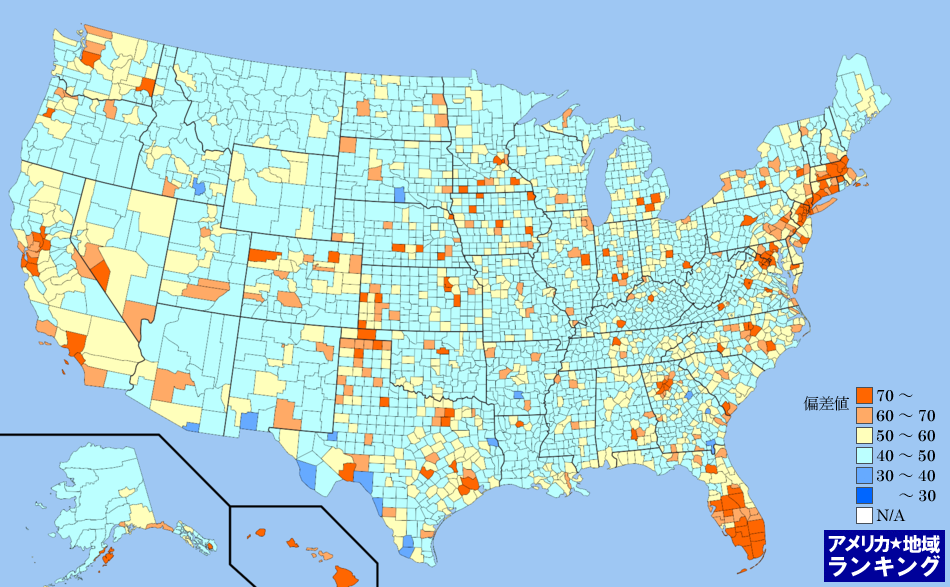
全米・人口にしめる外国からの移住割合(2010年7月~翌年6月末)ランキングマップ(郡別)
人口にしめる外国からの移住割合(2010年7月~翌年6月末)ランキング(郡別)の偏差値にしたがって色分けしたアメリカ合衆国の全郡マップです。アメリカ合衆国におけるすべての郡(州の下の地域区分)の平均と比べて、数値が高い地域はより赤く、数値が低い地域はより青く色分けしています。
アメリカ州のエリアをクリックしてください。その州内における郡のランキングページを表示します。