テキサス州の人口にしめる国内からの移住割合ランキング
| 順位 | 郡 | 人口にしめる国内からの移住割合
(2011年7月~翌年6月末) |
国内からの移住 |
人口 |
偏差値 | 評価 |
|---|
| 1 | King County |
4.62% |
  |
12人 | 260人 | 74.1 | - |
| 2 | McMullen County |
4.57% |
|
32人 | 700人 | 73.8 | - |
| 3 | Midland County |
3.74% |
|
5,233人 | 140,034人 | 69.7 | - |
| 4 | Kent County |
3.65% |
|
30人 | 822人 | 69.2 | - |
| 5 | Andrews County |
3.51% |
|
540人 | 15,394人 | 68.5 | - |
| 6 | Crane County |
3.51% |
|
153人 | 4,365人 | 68.5 | - |
| 7 | Kendall County |
3.47% |
|
1,202人 | 34,666人 | 68.3 | - |
| 8 | Lipscomb County |
3.32% |
|
111人 | 3,346人 | 67.5 | - |
| 9 | Wheeler County |
2.60% |
|
142人 | 5,472人 | 63.9 | - |
| 10 | Dimmit County |
2.53% |
|
256人 | 10,101人 | 63.6 | - |
| 11 | Ector County |
2.35% |
|
3,278人 | 139,588人 | 62.7 | - |
| 12 | Delta County |
2.34% |
|
122人 | 5,203人 | 62.7 | - |
| 13 | Hays County |
2.29% |
|
3,755人 | 163,746人 | 62.4 | - |
| 14 | Guadalupe County |
2.21% |
|
3,006人 | 135,843人 | 62.0 | - |
| 15 | Comal County |
2.12% |
|
2,365人 | 111,521人 | 61.5 | - |
| 16 | Hemphill County |
2.10% |
|
83人 | 3,956人 | 61.4 | - |
| 17 | Williamson County |
1.96% |
|
8,686人 | 442,291人 | 60.7 | - |
| 18 | Denton County |
1.95% |
|
13,360人 | 685,601人 | 60.7 | - |
| 19 | Karnes County |
1.93% |
|
289人 | 14,943人 | 60.6 | - |
| 20 | Winkler County |
1.92% |
|
137人 | 7,126人 | 60.5 | - |
| 21 | Goliad County |
1.83% |
|
132人 | 7,221人 | 60.1 | - |
| 22 | Montgomery County |
1.81% |
|
8,516人 | 471,704人 | 59.9 | - |
| 23 | Sterling County |
1.79% |
|
21人 | 1,170人 | 59.9 | - |
| 24 | Fort Bend County |
1.77% |
|
10,764人 | 607,952人 | 59.8 | - |
| 25 | Travis County |
1.73% |
|
18,309人 | 1,061,203人 | 59.5 | - |
| 26 | Aransas County |
1.69% |
|
396人 | 23,463人 | 59.4 | - |
| 27 | Roberts County |
1.68% |
|
14人 | 835人 | 59.3 | - |
| 28 | Reagan County |
1.66% |
|
56人 | 3,382人 | 59.2 | - |
| 29 | Somervell County |
1.63% |
|
138人 | 8,467人 | 59.1 | - |
| 30 | Atascosa County |
1.56% |
|
711人 | 45,471人 | 58.7 | - |
| 31 | Collin County |
1.46% |
|
11,833人 | 812,698人 | 58.2 | - |
| 32 | Rockwall County |
1.42% |
|
1,156人 | 81,179人 | 58.0 | - |
| 33 | Llano County |
1.38% |
|
262人 | 18,942人 | 57.8 | - |
| 34 | Lavaca County |
1.28% |
|
247人 | 19,223人 | 57.3 | - |
| 35 | Victoria County |
1.28% |
|
1,120人 | 87,454人 | 57.3 | - |
| 36 | Wilson County |
1.26% |
|
551人 | 43,697人 | 57.2 | - |
| 37 | Frio County |
1.26% |
|
218人 | 17,367人 | 57.2 | - |
| 38 | Chambers County |
1.23% |
|
436人 | 35,477人 | 57.1 | - |
| 39 | Jackson County |
1.21% |
|
170人 | 14,017人 | 57.0 | - |
| 40 | Live Oak County |
1.19% |
|
137人 | 11,531人 | 56.8 | - |
| 41 | Hood County |
1.12% |
|
578人 | 51,467人 | 56.5 | - |
| 42 | Ward County |
1.09% |
|
117人 | 10,713人 | 56.4 | - |
| 43 | Galveston County |
1.06% |
|
3,124人 | 295,193人 | 56.2 | - |
| 44 | Franklin County |
1.02% |
|
107人 | 10,525人 | 56.0 | - |
| 45 | Howard County |
0.99% |
|
345人 | 34,952人 | 55.8 | - |
| 46 | Shelby County |
0.98% |
|
252人 | 25,666人 | 55.8 | - |
| 47 | Ochiltree County |
0.97% |
|
102人 | 10,471人 | 55.8 | - |
| 48 | Scurry County |
0.92% |
|
156人 | 16,907人 | 55.5 | - |
| 49 | Knox County |
0.91% |
|
34人 | 3,750人 | 55.4 | - |
| 50 | Blanco County |
0.85% |
|
90人 | 10,581人 | 55.2 | - |
| 51 | Martin County |
0.83% |
|
41人 | 4,919人 | 55.1 | - |
| 52 | Gillespie County |
0.80% |
|
201人 | 25,038人 | 54.9 | - |
| 53 | San Patricio County |
0.79% |
|
512人 | 64,413人 | 54.9 | - |
| 54 | Gray County |
0.76% |
|
173人 | 22,733人 | 54.7 | - |
| 55 | Shackelford County |
0.75% |
|
25人 | 3,334人 | 54.6 | - |
| 56 | Parker County |
0.75% |
|
885人 | 118,348人 | 54.6 | - |
| 57 | Brazoria County |
0.74% |
|
2,373人 | 319,227人 | 54.6 | - |
| 58 | Bexar County |
0.74% |
|
12,910人 | 1,753,494人 | 54.6 | - |
| 59 | Glasscock County |
0.72% |
|
9人 | 1,242人 | 54.5 | - |
| 60 | Kaufman County |
0.71% |
|
747人 | 105,290人 | 54.4 | - |
| 61 | Calhoun County |
0.69% |
|
147人 | 21,370人 | 54.3 | - |
| 62 | San Jacinto County |
0.66% |
|
178人 | 26,876人 | 54.2 | - |
| 63 | Dallam County |
0.64% |
|
44人 | 6,842人 | 54.1 | - |
| 64 | Lampasas County |
0.63% |
|
125人 | 19,902人 | 54.0 | - |
| 65 | Armstrong County |
0.62% |
|
12人 | 1,928人 | 54.0 | - |
| 66 | DeWitt County |
0.62% |
|
126人 | 20,311人 | 54.0 | - |
| 67 | Tom Green County |
0.62% |
|
690人 | 111,738人 | 54.0 | - |
| 68 | Tarrant County |
0.61% |
|
11,264人 | 1,847,156人 | 53.9 | - |
| 69 | Randall County |
0.60% |
|
741人 | 123,558人 | 53.9 | - |
| 70 | Nueces County |
0.59% |
|
2,034人 | 343,085人 | 53.9 | - |
| 71 | Kerr County |
0.58% |
|
289人 | 49,625人 | 53.8 | - |
| 72 | Red River County |
0.55% |
|
70人 | 12,682人 | 53.7 | - |
| 73 | La Salle County |
0.54% |
|
38人 | 6,992人 | 53.6 | - |
| 74 | Castro County |
0.54% |
|
43人 | 8,034人 | 53.6 | - |
| 75 | Jim Wells County |
0.52% |
|
216人 | 41,235人 | 53.5 | - |
| 76 | Wise County |
0.49% |
|
293人 | 59,890人 | 53.3 | - |
| 77 | Cooke County |
0.48% |
|
184人 | 38,367人 | 53.3 | - |
| 78 | Henderson County |
0.47% |
|
372人 | 78,753人 | 53.3 | - |
| 79 | Orange County |
0.46% |
|
381人 | 82,384人 | 53.2 | - |
| 80 | Dallas County |
0.45% |
|
10,904人 | 2,408,016人 | 53.2 | - |
| 81 | Gaines County |
0.45% |
|
81人 | 18,056人 | 53.1 | - |
| 82 | Wood County |
0.45% |
|
187人 | 42,009人 | 53.1 | - |
| 83 | Burleson County |
0.38% |
|
66人 | 17,212人 | 52.8 | - |
| 84 | Hartley County |
0.36% |
|
22人 | 6,085人 | 52.7 | - |
| 85 | Harris County |
0.36% |
|
15,060人 | 4,173,695人 | 52.7 | - |
| 86 | Reeves County |
0.36% |
|
49人 | 13,684人 | 52.7 | - |
| 87 | Menard County |
0.36% |
|
8人 | 2,235人 | 52.7 | - |
| 88 | Gonzales County |
0.35% |
|
70人 | 19,844人 | 52.7 | - |
| 89 | Johnson County |
0.34% |
|
524人 | 151,940人 | 52.6 | - |
| 90 | Ellis County |
0.34% |
|
517人 | 152,391人 | 52.6 | - |
| 91 | Liberty County |
0.34% |
|
257人 | 75,945人 | 52.6 | - |
| 92 | Rusk County |
0.32% |
|
173人 | 53,689人 | 52.5 | - |
| 93 | Smith County |
0.32% |
|
672人 | 212,855人 | 52.5 | - |
| 94 | Childress County |
0.30% |
|
21人 | 7,003人 | 52.4 | - |
| 95 | Erath County |
0.30% |
|
116人 | 39,000人 | 52.4 | - |
| 96 | Crosby County |
0.30% |
|
18人 | 6,080人 | 52.4 | - |
| 97 | Medina County |
0.29% |
|
135人 | 46,443人 | 52.3 | - |
| 98 | Crockett County |
0.27% |
|
10人 | 3,689人 | 52.2 | - |
| 99 | Caldwell County |
0.23% |
|
87人 | 38,440人 | 52.0 | - |
| 100 | Grayson County |
0.21% |
|
260人 | 121,306人 | 52.0 | - |
| 101 | Swisher County |
0.19% |
|
15人 | 7,826人 | 51.8 | - |
| 102 | Bell County |
0.17% |
|
544人 | 315,937人 | 51.7 | - |
| 103 | Upshur County |
0.16% |
|
65人 | 39,784人 | 51.7 | - |
| 104 | McCulloch County |
0.16% |
|
13人 | 8,296人 | 51.7 | - |
| 105 | Bandera County |
0.16% |
|
32人 | 20,535人 | 51.7 | - |
| 106 | Bee County |
0.15% |
|
50人 | 32,338人 | 51.7 | - |
| 107 | Hunt County |
0.15% |
|
134人 | 86,669人 | 51.7 | - |
| 108 | Uvalde County |
0.15% |
|
39人 | 26,540人 | 51.6 | - |
| 109 | Polk County |
0.14% |
|
64人 | 45,659人 | 51.6 | - |
| 110 | Jeff Davis County |
0.13% |
|
3人 | 2,303人 | 51.5 | - |
| 111 | Limestone County |
0.12% |
|
29人 | 23,497人 | 51.5 | - |
| 112 | Callahan County |
0.12% |
|
16人 | 13,547人 | 51.5 | - |
| 113 | Lubbock County |
0.11% |
|
303人 | 283,286人 | 51.4 | - |
| 114 | Washington County |
0.10% |
|
35人 | 33,983人 | 51.4 | - |
| 115 | Mason County |
0.10% |
|
4人 | 4,015人 | 51.4 | - |
| 116 | Brazos County |
0.09% |
|
185人 | 197,539人 | 51.3 | - |
| 117 | Walker County |
0.04% |
|
25人 | 68,203人 | 51.1 | - |
| 118 | Nacogdoches County |
0.00% |
|
1人 | 65,612人 | 50.9 | - |
| 119 | Camp County |
0.00% |
|
0人 | 12,394人 | 50.9 | - |
| 119 | Zavala County |
0.00% |
|
0人 | 11,825人 | 50.9 | - |
| 121 | Fannin County |
-0.01% |
|
-5人 | 33,884人 | 50.8 | - |
| 122 | Mills County |
-0.02% |
|
-1人 | 4,869人 | 50.8 | - |
| 123 | Cherokee County |
-0.04% |
- |
-19人 | 50,961人 | 50.7 | - |
| 124 | Bowie County |
-0.04% |
- |
-36人 | 92,915人 | 50.7 | - |
| 125 | Fayette County |
-0.04% |
- |
-11人 | 24,755人 | 50.7 | - |
| 126 | Burnet County |
-0.06% |
- |
-28人 | 43,393人 | 50.6 | - |
| 127 | Sherman County |
-0.07% |
- |
-2人 | 3,045人 | 50.5 | - |
| 128 | Stonewall County |
-0.07% |
- |
-1人 | 1,482人 | 50.5 | - |
| 129 | El Paso County |
-0.08% |
- |
-646人 | 817,982人 | 50.5 | - |
| 130 | Hopkins County |
-0.09% |
- |
-33人 | 35,358人 | 50.4 | - |
| 131 | Angelina County |
-0.10% |
- |
-91人 | 87,276人 | 50.4 | - |
| 132 | Waller County |
-0.11% |
- |
-49人 | 44,023人 | 50.3 | - |
| 133 | Hardin County |
-0.15% |
- |
-83人 | 55,069人 | 50.1 | - |
| 134 | Hockley County |
-0.15% |
- |
-35人 | 22,979人 | 50.1 | - |
| 135 | Hidalgo County |
-0.16% |
- |
-1,251人 | 794,181人 | 50.1 | - |
| 136 | Webb County |
-0.16% |
- |
-406人 | 254,948人 | 50.1 | - |
| 137 | Kinney County |
-0.17% |
- |
-6人 | 3,598人 | 50.0 | - |
| テキサス州郡の平均 |
-0.18% |
- |
555人 | 100,913人 | 50.0 | - |
| 138 | Anderson County |
-0.20% |
- |
-117人 | 58,356人 | 49.9 | - |
| 139 | Grimes County |
-0.20% |
- |
-54人 | 26,730人 | 49.9 | - |
| 140 | Yoakum County |
-0.21% |
- |
-17人 | 7,996人 | 49.8 | - |
| 141 | San Augustine County |
-0.21% |
- |
-19人 | 8,869人 | 49.8 | - |
| 142 | Taylor County |
-0.22% |
- |
-296人 | 132,656人 | 49.8 | - |
| 143 | Wichita County |
-0.25% |
- |
-332人 | 130,642人 | 49.6 | - |
| 144 | Harrison County |
-0.26% |
- |
-172人 | 67,302人 | 49.6 | - |
| 145 | Young County |
-0.26% |
- |
-47人 | 18,385人 | 49.6 | - |
| 146 | Donley County |
-0.28% |
- |
-10人 | 3,629人 | 49.5 | - |
| 147 | Panola County |
-0.28% |
- |
-67人 | 24,039人 | 49.5 | - |
| 148 | McLennan County |
-0.33% |
- |
-787人 | 237,811人 | 49.2 | - |
| 149 | Gregg County |
-0.34% |
- |
-410人 | 122,325人 | 49.2 | - |
| 150 | Navarro County |
-0.34% |
- |
-162人 | 47,963人 | 49.2 | - |
| 151 | Titus County |
-0.34% |
- |
-110人 | 32,441人 | 49.2 | - |
| 152 | Colorado County |
-0.38% |
- |
-78人 | 20,742人 | 49.0 | - |
| 153 | Van Zandt County |
-0.38% |
- |
-201人 | 52,638人 | 49.0 | - |
| 154 | Morris County |
-0.40% |
- |
-51人 | 12,822人 | 48.9 | - |
| 155 | Bosque County |
-0.41% |
- |
-74人 | 18,244人 | 48.8 | - |
| 156 | Lee County |
-0.41% |
- |
-68人 | 16,631人 | 48.8 | - |
| 157 | Hill County |
-0.43% |
- |
-151人 | 35,173人 | 48.7 | - |
| 158 | Lamar County |
-0.45% |
- |
-225人 | 49,987人 | 48.6 | - |
| 159 | Edwards County |
-0.46% |
- |
-9人 | 1,969人 | 48.6 | - |
| 160 | Austin County |
-0.47% |
- |
-136人 | 28,634人 | 48.5 | - |
| 161 | Terry County |
-0.48% |
- |
-61人 | 12,598人 | 48.4 | - |
| 162 | Hutchinson County |
-0.49% |
- |
-108人 | 21,922人 | 48.4 | - |
| 163 | Motley County |
-0.49% |
- |
-6人 | 1,215人 | 48.4 | - |
| 164 | Wharton County |
-0.52% |
- |
-213人 | 41,264人 | 48.3 | - |
| 165 | Leon County |
-0.52% |
- |
-88人 | 16,872人 | 48.3 | - |
| 166 | Moore County |
-0.54% |
- |
-118人 | 22,041人 | 48.2 | - |
| 167 | Madison County |
-0.54% |
- |
-74人 | 13,711人 | 48.2 | - |
| 168 | Coleman County |
-0.59% |
- |
-52人 | 8,757人 | 47.9 | - |
| 169 | Brown County |
-0.60% |
- |
-227人 | 38,013人 | 47.9 | - |
| 170 | Stephens County |
-0.63% |
- |
-60人 | 9,523人 | 47.7 | - |
| 171 | Eastland County |
-0.64% |
- |
-118人 | 18,574人 | 47.7 | - |
| 172 | Floyd County |
-0.64% |
- |
-41人 | 6,387人 | 47.7 | - |
| 173 | Cameron County |
-0.64% |
- |
-2,649人 | 412,577人 | 47.7 | - |
| 174 | Maverick County |
-0.64% |
- |
-354人 | 55,082人 | 47.7 | - |
| 175 | Willacy County |
-0.66% |
- |
-145人 | 22,057人 | 47.6 | - |
| 176 | Rains County |
-0.68% |
- |
-75人 | 11,026人 | 47.5 | - |
| 177 | Bastrop County |
-0.68% |
- |
-513人 | 75,028人 | 47.4 | - |
| 178 | Hall County |
-0.70% |
- |
-23人 | 3,306人 | 47.4 | - |
| 179 | Potter County |
-0.74% |
- |
-898人 | 121,938人 | 47.2 | - |
| 180 | Marion County |
-0.77% |
- |
-81人 | 10,464人 | 47.0 | - |
| 181 | Archer County |
-0.78% |
- |
-69人 | 8,792人 | 46.9 | - |
| 182 | Cass County |
-0.82% |
- |
-251人 | 30,508人 | 46.7 | - |
| 183 | Houston County |
-0.82% |
- |
-193人 | 23,394人 | 46.7 | - |
| 184 | San Saba County |
-0.83% |
- |
-50人 | 6,060人 | 46.7 | - |
| 185 | Hamilton County |
-0.83% |
- |
-70人 | 8,417人 | 46.7 | - |
| 186 | Montague County |
-0.84% |
- |
-166人 | 19,746人 | 46.7 | - |
| 187 | Freestone County |
-0.86% |
- |
-169人 | 19,632人 | 46.6 | - |
| 188 | Matagorda County |
-0.88% |
- |
-322人 | 36,708人 | 46.5 | - |
| 189 | Coke County |
-0.88% |
- |
-29人 | 3,283人 | 46.4 | - |
| 190 | Kimble County |
-0.89% |
- |
-41人 | 4,598人 | 46.4 | - |
| 191 | Hale County |
-0.90% |
- |
-327人 | 36,437人 | 46.4 | - |
| 192 | Clay County |
-0.95% |
- |
-101人 | 10,658人 | 46.1 | - |
| 193 | Tyler County |
-0.95% |
- |
-207人 | 21,680人 | 46.1 | - |
| 194 | Hardeman County |
-0.97% |
- |
-40人 | 4,112人 | 46.0 | - |
| 195 | Zapata County |
-0.98% |
- |
-139人 | 14,193人 | 46.0 | - |
| 196 | Haskell County |
-0.99% |
- |
-59人 | 5,974人 | 45.9 | - |
| 197 | Comanche County |
-1.00% |
- |
-139人 | 13,892人 | 45.9 | - |
| 198 | Mitchell County |
-1.02% |
- |
-96人 | 9,405人 | 45.8 | - |
| 199 | Jack County |
-1.03% |
- |
-93人 | 9,043人 | 45.7 | - |
| 200 | Brewster County |
-1.06% |
- |
-99人 | 9,361人 | 45.6 | - |
| 201 | Jefferson County |
-1.10% |
- |
-2,777人 | 253,160人 | 45.4 | - |
| 202 | Duval County |
-1.15% |
- |
-136人 | 11,803人 | 45.1 | - |
| 203 | Palo Pinto County |
-1.18% |
- |
-333人 | 28,120人 | 44.9 | - |
| 204 | Runnels County |
-1.22% |
- |
-129人 | 10,570人 | 44.7 | - |
| 205 | Newton County |
-1.24% |
- |
-179人 | 14,418人 | 44.6 | - |
| 206 | Pecos County |
-1.25% |
- |
-195人 | 15,653人 | 44.6 | - |
| 207 | Refugio County |
-1.30% |
- |
-95人 | 7,314人 | 44.4 | - |
| 208 | Jasper County |
-1.30% |
- |
-472人 | 36,268人 | 44.3 | - |
| 209 | Brooks County |
-1.31% |
- |
-94人 | 7,186人 | 44.3 | - |
| 210 | Starr County |
-1.36% |
- |
-837人 | 61,498人 | 44.0 | - |
| 211 | Carson County |
-1.37% |
- |
-86人 | 6,272人 | 44.0 | - |
| 212 | Coryell County |
-1.37% |
- |
-1,052人 | 76,551人 | 44.0 | - |
| 213 | Robertson County |
-1.41% |
- |
-236人 | 16,711人 | 43.8 | - |
| 214 | Kleberg County |
-1.44% |
- |
-461人 | 32,090人 | 43.7 | - |
| 215 | Jim Hogg County |
-1.44% |
- |
-76人 | 5,283人 | 43.7 | - |
| 216 | Cottle County |
-1.46% |
- |
-22人 | 1,509人 | 43.6 | - |
| 217 | Val Verde County |
-1.48% |
- |
-724人 | 48,855人 | 43.4 | - |
| 218 | Jones County |
-1.48% |
- |
-301人 | 20,278人 | 43.4 | - |
| 219 | Real County |
-1.49% |
- |
-51人 | 3,433人 | 43.4 | - |
| 220 | Wilbarger County |
-1.49% |
- |
-200人 | 13,422人 | 43.4 | - |
| 221 | Falls County |
-1.50% |
- |
-268人 | 17,845人 | 43.3 | - |
| 222 | Dawson County |
-1.52% |
- |
-210人 | 13,783人 | 43.2 | - |
| 223 | Trinity County |
-1.55% |
- |
-225人 | 14,562人 | 43.1 | - |
| 224 | Sabine County |
-1.57% |
- |
-167人 | 10,639人 | 43.0 | - |
| 225 | Throckmorton County |
-1.59% |
- |
-26人 | 1,640人 | 42.9 | - |
| 226 | Nolan County |
-1.62% |
- |
-245人 | 15,145人 | 42.8 | - |
| 227 | Deaf Smith County |
-1.64% |
- |
-319人 | 19,446人 | 42.6 | - |
| 228 | Upton County |
-1.66% |
- |
-55人 | 3,305人 | 42.5 | - |
| 229 | Oldham County |
-1.68% |
- |
-35人 | 2,085人 | 42.4 | - |
| 230 | Lamb County |
-1.75% |
- |
-247人 | 14,130人 | 42.1 | - |
| 231 | Bailey County |
-1.92% |
- |
-138人 | 7,169人 | 41.2 | - |
| 232 | Concho County |
-1.98% |
- |
-81人 | 4,093人 | 40.9 | - |
| 233 | Baylor County |
-2.05% |
- |
-76人 | 3,715人 | 40.6 | - |
| 234 | Schleicher County |
-2.06% |
- |
-68人 | 3,305人 | 40.5 | - |
| 235 | Hansford County |
-2.06% |
- |
-115人 | 5,588人 | 40.5 | - |
| 236 | Kenedy County |
-2.06% |
- |
-9人 | 437人 | 40.5 | - |
| 237 | Fisher County |
-2.13% |
- |
-84人 | 3,950人 | 40.2 | - |
| 238 | Borden County |
-2.24% |
- |
-14人 | 625人 | 39.6 | - |
| 239 | Lynn County |
-2.29% |
- |
-135人 | 5,889人 | 39.4 | - |
| 240 | Milam County |
-2.38% |
- |
-587人 | 24,665人 | 38.9 | - |
| 241 | Sutton County |
-2.39% |
- |
-96人 | 4,012人 | 38.9 | - |
| 242 | Irion County |
-2.48% |
- |
-40人 | 1,610人 | 38.4 | - |
| 243 | Cochran County |
-2.51% |
- |
-77人 | 3,071人 | 38.3 | - |
| 244 | Parmer County |
-2.51% |
- |
-259人 | 10,306人 | 38.3 | - |
| 245 | Garza County |
-2.60% |
- |
-170人 | 6,545人 | 37.8 | - |
| 246 | Collingsworth County |
-2.77% |
- |
-86人 | 3,104人 | 37.0 | - |
| 247 | Presidio County |
-3.21% |
- |
-248人 | 7,715人 | 34.7 | - |
| 248 | Foard County |
-3.26% |
- |
-44人 | 1,350人 | 34.5 | - |
| 249 | Dickens County |
-3.37% |
- |
-81人 | 2,401人 | 33.9 | - |
| 250 | Culberson County |
-3.88% |
- |
-92人 | 2,371人 | 31.4 | - |
| 251 | Hudspeth County |
-3.97% |
- |
-136人 | 3,426人 | 30.9 | - |
| 252 | Terrell County |
-4.64% |
- |
-44人 | 948人 | 27.6 | - |
| 253 | Briscoe County |
-6.10% |
- |
-100人 | 1,640人 | 20.2 | - |
| 254 | Loving County |
-21.74% |
- |
-20人 | 92人 | -58.3 | - |
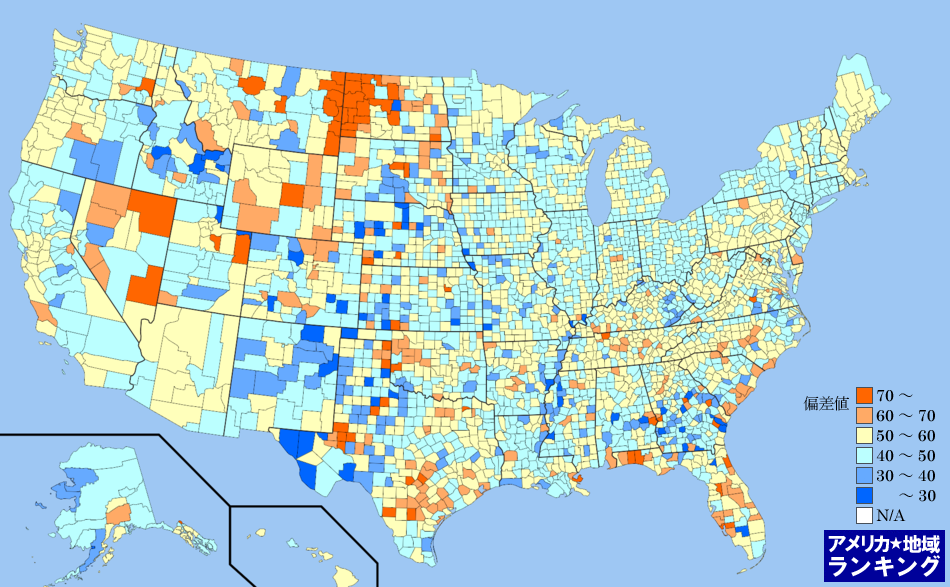
全米・人口にしめる国内からの移住割合(2011年7月~翌年6月末)ランキングマップ(郡別)
人口にしめる国内からの移住割合(2011年7月~翌年6月末)ランキング(郡別)の偏差値にしたがって色分けしたアメリカ合衆国の全郡マップです。アメリカ合衆国におけるすべての郡(州の下の地域区分)の平均と比べて、数値が高い地域はより赤く、数値が低い地域はより青く色分けしています。
アメリカ州のエリアをクリックしてください。その州内における郡のランキングページを表示します。