ネブラスカ州の人口にしめる国内からの移住割合ランキング
| 順位 | 郡 | 人口にしめる国内からの移住割合
(2011年7月~翌年6月末) |
国内からの移住 |
人口 |
偏差値 | 評価 |
|---|
| 1 | Gosper County |
3.94% |
  |
77人 | 1,954人 | 79.2 | - |
| 2 | Blaine County |
2.82% |
|
14人 | 497人 | 71.9 | - |
| 3 | Dundy County |
2.57% |
|
51人 | 1,983人 | 70.3 | - |
| 4 | Banner County |
2.17% |
|
16人 | 738人 | 67.6 | - |
| 5 | Arthur County |
1.49% |
|
7人 | 471人 | 63.2 | - |
| 6 | Chase County |
1.45% |
|
58人 | 4,006人 | 62.9 | - |
| 7 | Seward County |
1.06% |
|
177人 | 16,727人 | 60.4 | - |
| 8 | Garfield County |
1.05% |
|
21人 | 1,992人 | 60.4 | - |
| 9 | Merrick County |
0.82% |
|
63人 | 7,721人 | 58.8 | - |
| 10 | Buffalo County |
0.81% |
|
378人 | 46,720人 | 58.8 | - |
| 11 | Hitchcock County |
0.77% |
|
22人 | 2,873人 | 58.5 | - |
| 12 | Deuel County |
0.71% |
|
14人 | 1,970人 | 58.1 | - |
| 13 | Nuckolls County |
0.70% |
|
31人 | 4,444人 | 58.0 | - |
| 14 | Boone County |
0.69% |
|
37人 | 5,392人 | 57.9 | - |
| 15 | Sarpy County |
0.64% |
|
1,037人 | 162,598人 | 57.6 | - |
| 16 | Cheyenne County |
0.51% |
|
51人 | 9,971人 | 56.8 | - |
| 17 | Pawnee County |
0.47% |
|
13人 | 2,772人 | 56.5 | - |
| 18 | Adams County |
0.34% |
|
107人 | 31,242人 | 55.7 | - |
| 19 | Thayer County |
0.31% |
|
16人 | 5,162人 | 55.5 | - |
| 20 | Phelps County |
0.26% |
|
24人 | 9,178人 | 55.2 | - |
| 21 | Lancaster County |
0.24% |
|
702人 | 289,853人 | 55.0 | - |
| 22 | York County |
0.19% |
|
26人 | 13,677人 | 54.7 | - |
| 23 | Jefferson County |
0.19% |
|
14人 | 7,541人 | 54.7 | - |
| 24 | Knox County |
0.17% |
|
15人 | 8,584人 | 54.6 | - |
| 25 | Hall County |
0.17% |
|
104人 | 59,541人 | 54.6 | - |
| 26 | Saline County |
0.05% |
|
7人 | 14,398人 | 53.8 | - |
| 27 | Douglas County |
0.03% |
|
164人 | 524,976人 | 53.7 | - |
| 28 | Sherman County |
0.00% |
|
0人 | 3,138人 | 53.5 | - |
| 28 | Logan County |
0.00% |
|
0人 | 767人 | 53.5 | - |
| 30 | Howard County |
-0.02% |
|
-1人 | 6,322人 | 53.4 | - |
| 31 | Red Willow County |
-0.02% |
|
-2人 | 10,992人 | 53.3 | - |
| 32 | Keith County |
-0.02% |
- |
-2人 | 8,226人 | 53.3 | - |
| 33 | Kimball County |
-0.03% |
- |
-1人 | 3,781人 | 53.3 | - |
| 34 | Wayne County |
-0.05% |
- |
-5人 | 9,515人 | 53.1 | - |
| 35 | Webster County |
-0.08% |
- |
-3人 | 3,761人 | 52.9 | - |
| 36 | Washington County |
-0.12% |
- |
-25人 | 20,259人 | 52.7 | - |
| 37 | Butler County |
-0.13% |
- |
-11人 | 8,311人 | 52.6 | - |
| 38 | Cedar County |
-0.16% |
- |
-14人 | 8,775人 | 52.4 | - |
| 39 | Cherry County |
-0.17% |
- |
-10人 | 5,737人 | 52.3 | - |
| 40 | Furnas County |
-0.18% |
- |
-9人 | 4,943人 | 52.3 | - |
| 41 | Frontier County |
-0.18% |
- |
-5人 | 2,734人 | 52.3 | - |
| 42 | Box Butte County |
-0.23% |
- |
-26人 | 11,305人 | 52.0 | - |
| 43 | Scotts Bluff County |
-0.24% |
- |
-88人 | 36,929人 | 51.9 | - |
| 44 | Madison County |
-0.26% |
- |
-90人 | 34,950人 | 51.8 | - |
| 45 | Valley County |
-0.26% |
- |
-11人 | 4,245人 | 51.8 | - |
| 46 | Richardson County |
-0.28% |
- |
-23人 | 8,340人 | 51.7 | - |
| 47 | Harlan County |
-0.29% |
- |
-10人 | 3,429人 | 51.6 | - |
| 48 | Platte County |
-0.31% |
- |
-100人 | 32,482人 | 51.4 | - |
| 49 | Pierce County |
-0.33% |
- |
-24人 | 7,188人 | 51.3 | - |
| 50 | Lincoln County |
-0.39% |
- |
-140人 | 36,112人 | 50.9 | - |
| 51 | Perkins County |
-0.48% |
- |
-14人 | 2,938人 | 50.3 | - |
| 52 | Otoe County |
-0.48% |
- |
-76人 | 15,791人 | 50.3 | - |
| 53 | Polk County |
-0.49% |
- |
-26人 | 5,345人 | 50.3 | - |
| 54 | Franklin County |
-0.50% |
- |
-16人 | 3,212人 | 50.2 | - |
| 55 | Holt County |
-0.53% |
- |
-55人 | 10,447人 | 50.0 | - |
| ネブラスカ州郡の平均 |
-0.53% |
- |
-10人 | 19,809人 | 50.0 | - |
| 56 | Cass County |
-0.58% |
- |
-146人 | 25,233人 | 49.7 | - |
| 57 | Saunders County |
-0.60% |
- |
-126人 | 20,853人 | 49.5 | - |
| 58 | Hamilton County |
-0.67% |
- |
-61人 | 9,076人 | 49.1 | - |
| 59 | Dawes County |
-0.67% |
- |
-62人 | 9,207人 | 49.1 | - |
| 60 | Gage County |
-0.71% |
- |
-156人 | 21,998人 | 48.8 | - |
| 61 | Sheridan County |
-0.80% |
- |
-43人 | 5,387人 | 48.2 | - |
| 62 | Johnson County |
-0.81% |
- |
-42人 | 5,186人 | 48.2 | - |
| 63 | Custer County |
-0.82% |
- |
-89人 | 10,868人 | 48.1 | - |
| 64 | Thurston County |
-0.85% |
- |
-59人 | 6,953人 | 47.9 | - |
| 65 | Clay County |
-0.86% |
- |
-56人 | 6,478人 | 47.8 | - |
| 66 | Cuming County |
-0.88% |
- |
-80人 | 9,140人 | 47.7 | - |
| 67 | Nance County |
-0.94% |
- |
-35人 | 3,738人 | 47.3 | - |
| 68 | Dodge County |
-0.99% |
- |
-365人 | 36,706人 | 47.0 | - |
| 69 | Boyd County |
-1.01% |
- |
-21人 | 2,081人 | 46.9 | - |
| 70 | Thomas County |
-1.02% |
- |
-7人 | 683人 | 46.8 | - |
| 71 | Fillmore County |
-1.03% |
- |
-60人 | 5,848人 | 46.7 | - |
| 72 | Morrill County |
-1.07% |
- |
-53人 | 4,937人 | 46.4 | - |
| 73 | Kearney County |
-1.16% |
- |
-76人 | 6,562人 | 45.9 | - |
| 74 | Sioux County |
-1.21% |
- |
-16人 | 1,327人 | 45.6 | - |
| 75 | Nemaha County |
-1.23% |
- |
-89人 | 7,257人 | 45.4 | - |
| 76 | Colfax County |
-1.30% |
- |
-138人 | 10,614人 | 45.0 | - |
| 77 | Brown County |
-1.40% |
- |
-43人 | 3,082人 | 44.3 | - |
| 78 | Burt County |
-1.46% |
- |
-99人 | 6,790人 | 43.9 | - |
| 79 | Dakota County |
-1.52% |
- |
-318人 | 20,905人 | 43.5 | - |
| 80 | Antelope County |
-1.67% |
- |
-111人 | 6,631人 | 42.5 | - |
| 81 | Dixon County |
-1.86% |
- |
-112人 | 6,010人 | 41.3 | - |
| 82 | Dawson County |
-1.89% |
- |
-461人 | 24,386人 | 41.1 | - |
| 83 | Stanton County |
-2.10% |
- |
-130人 | 6,181人 | 39.7 | - |
| 84 | Grant County |
-2.36% |
- |
-15人 | 636人 | 38.0 | - |
| 85 | Greeley County |
-2.65% |
- |
-67人 | 2,528人 | 36.1 | - |
| 86 | Wheeler County |
-2.81% |
- |
-23人 | 819人 | 35.1 | - |
| 87 | Garden County |
-3.20% |
- |
-65人 | 2,034人 | 32.6 | - |
| 88 | Keya Paha County |
-3.27% |
- |
-27人 | 826人 | 32.1 | - |
| 89 | Rock County |
-3.29% |
- |
-47人 | 1,428人 | 31.9 | - |
| 90 | Hayes County |
-3.47% |
- |
-34人 | 980人 | 30.8 | - |
| 91 | Hooker County |
-3.47% |
- |
-26人 | 749人 | 30.8 | - |
| 92 | Loup County |
-3.91% |
- |
-24人 | 614人 | 27.9 | - |
| 93 | McPherson County |
-8.03% |
- |
-44人 | 548人 | 0.9 | - |
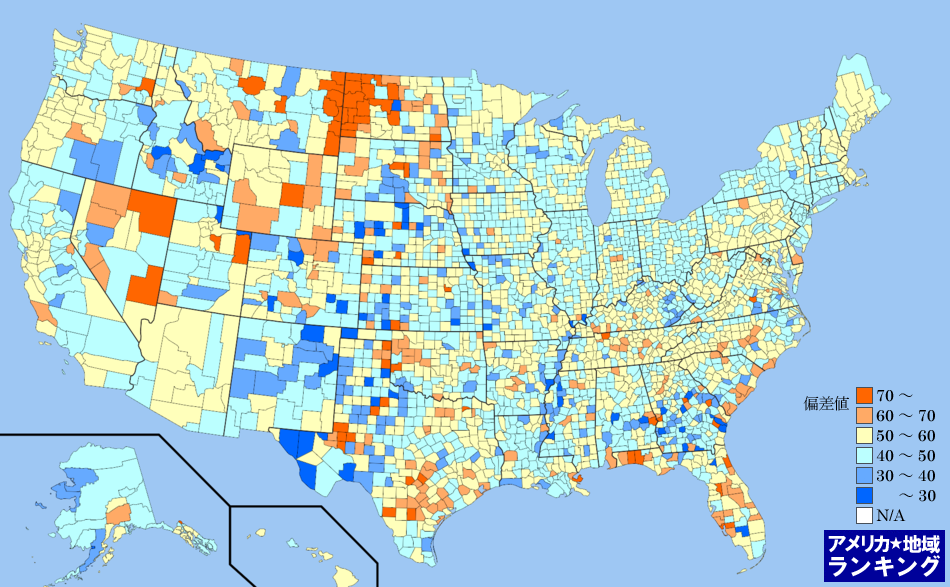
全米・人口にしめる国内からの移住割合(2011年7月~翌年6月末)ランキングマップ(郡別)
人口にしめる国内からの移住割合(2011年7月~翌年6月末)ランキング(郡別)の偏差値にしたがって色分けしたアメリカ合衆国の全郡マップです。アメリカ合衆国におけるすべての郡(州の下の地域区分)の平均と比べて、数値が高い地域はより赤く、数値が低い地域はより青く色分けしています。
アメリカ州のエリアをクリックしてください。その州内における郡のランキングページを表示します。