ミズーリ州の人口にしめる国内からの移住割合ランキング
| 順位 | 郡 | 人口にしめる国内からの移住割合
(2010年7月~翌年6月末) |
国内からの移住 |
人口 |
偏差値 | 評価 |
|---|
| 1 | Oregon County |
1.36% |
  |
149人 | 10,929人 | 75.2 | - |
| 2 | Gentry County |
1.31% |
|
88人 | 6,727人 | 74.4 | - |
| 3 | Taney County |
0.95% |
|
495人 | 51,908人 | 69.1 | - |
| 4 | Ralls County |
0.90% |
|
92人 | 10,183人 | 68.3 | - |
| 5 | Madison County |
0.86% |
|
105人 | 12,190人 | 67.7 | - |
| 6 | Pike County |
0.80% |
|
147人 | 18,486人 | 66.7 | - |
| 7 | Crawford County |
0.75% |
|
184人 | 24,625人 | 66.0 | - |
| 8 | Johnson County |
0.70% |
|
371人 | 52,701人 | 65.3 | - |
| 9 | Boone County |
0.64% |
|
1,040人 | 163,222人 | 64.3 | - |
| 10 | Cape Girardeau County |
0.62% |
|
473人 | 75,848人 | 64.1 | - |
| 11 | Newton County |
0.61% |
|
353人 | 58,124人 | 63.8 | - |
| 12 | Butler County |
0.55% |
|
237人 | 42,820人 | 63.0 | - |
| 13 | Carter County |
0.54% |
|
34人 | 6,301人 | 62.8 | - |
| 14 | Platte County |
0.48% |
|
432人 | 89,729人 | 62.0 | - |
| 15 | Bollinger County |
0.38% |
|
47人 | 12,339人 | 60.4 | - |
| 16 | Clay County |
0.32% |
|
718人 | 222,729人 | 59.6 | - |
| 17 | Greene County |
0.27% |
|
752人 | 275,442人 | 58.8 | - |
| 18 | Christian County |
0.27% |
|
207人 | 77,871人 | 58.7 | - |
| 19 | Howard County |
0.25% |
|
25人 | 10,129人 | 58.4 | - |
| 20 | Ripley County |
0.21% |
|
30人 | 14,112人 | 57.9 | - |
| 21 | Miller County |
0.21% |
|
52人 | 24,728人 | 57.9 | - |
| 22 | Maries County |
0.20% |
|
18人 | 9,185人 | 57.7 | - |
| 23 | Lewis County |
0.19% |
|
19人 | 10,192人 | 57.5 | - |
| 24 | St. Charles County |
0.16% |
|
586人 | 361,745人 | 57.1 | - |
| 25 | Dallas County |
0.16% |
|
27人 | 16,749人 | 57.1 | - |
| 26 | Audrain County |
0.16% |
|
41人 | 25,468人 | 57.1 | - |
| 27 | Moniteau County |
0.12% |
|
18人 | 15,637人 | 56.4 | - |
| 28 | Osage County |
0.11% |
|
15人 | 13,870人 | 56.3 | - |
| 29 | Livingston County |
0.10% |
|
15人 | 15,145人 | 56.2 | - |
| 30 | St. Francois County |
0.09% |
|
60人 | 65,563人 | 56.1 | - |
| 31 | Buchanan County |
0.07% |
|
66人 | 89,062人 | 55.8 | - |
| 32 | Dunklin County |
0.07% |
|
23人 | 31,919人 | 55.8 | - |
| 33 | Lincoln County |
0.06% |
|
33人 | 52,684人 | 55.6 | - |
| 34 | Ste. Genevieve County |
0.06% |
|
11人 | 18,127人 | 55.6 | - |
| 35 | Benton County |
0.06% |
|
11人 | 19,108人 | 55.6 | - |
| 36 | Nodaway County |
0.03% |
|
6人 | 23,380人 | 55.1 | - |
| 37 | Douglas County |
-0.04% |
- |
-5人 | 13,643人 | 54.2 | - |
| 38 | DeKalb County |
-0.04% |
- |
-5人 | 12,863人 | 54.1 | - |
| 39 | Cole County |
-0.07% |
- |
-50人 | 76,111人 | 53.7 | - |
| 40 | Howell County |
-0.08% |
- |
-31人 | 40,584人 | 53.6 | - |
| 41 | Polk County |
-0.08% |
- |
-25人 | 31,137人 | 53.5 | - |
| 42 | Hickory County |
-0.08% |
- |
-8人 | 9,638人 | 53.5 | - |
| 43 | Grundy County |
-0.09% |
- |
-9人 | 10,267人 | 53.4 | - |
| 44 | Putnam County |
-0.12% |
- |
-6人 | 4,971人 | 52.9 | - |
| 45 | Bates County |
-0.13% |
- |
-22人 | 17,050人 | 52.8 | - |
| 46 | Mercer County |
-0.13% |
- |
-5人 | 3,777人 | 52.7 | - |
| 47 | Henry County |
-0.13% |
- |
-30人 | 22,257人 | 52.7 | - |
| 48 | Montgomery County |
-0.14% |
- |
-17人 | 12,241人 | 52.6 | - |
| 49 | Carroll County |
-0.14% |
- |
-13人 | 9,280人 | 52.6 | - |
| 50 | Franklin County |
-0.17% |
- |
-171人 | 101,535人 | 52.2 | - |
| 51 | Jefferson County |
-0.18% |
- |
-392人 | 219,092人 | 52.0 | - |
| 52 | Barton County |
-0.19% |
- |
-23人 | 12,377人 | 51.9 | - |
| 53 | Cass County |
-0.20% |
- |
-203人 | 99,743人 | 51.6 | - |
| 54 | Stone County |
-0.23% |
- |
-74人 | 32,048人 | 51.2 | - |
| 55 | Shannon County |
-0.24% |
- |
-20人 | 8,437人 | 51.1 | - |
| 56 | Lawrence County |
-0.24% |
- |
-94人 | 38,602人 | 51.0 | - |
| 57 | Reynolds County |
-0.25% |
- |
-17人 | 6,690人 | 50.9 | - |
| 58 | Marion County |
-0.28% |
- |
-82人 | 28,776人 | 50.4 | - |
| 59 | Scotland County |
-0.29% |
- |
-14人 | 4,833人 | 50.3 | - |
| ミズーリ州郡の平均 |
-0.31% |
- |
-124人 | 52,140人 | 50.0 | - |
| 60 | Cooper County |
-0.33% |
- |
-58人 | 17,573人 | 49.7 | - |
| 61 | Mississippi County |
-0.35% |
- |
-50人 | 14,333人 | 49.5 | - |
| 62 | Knox County |
-0.36% |
- |
-15人 | 4,127人 | 49.2 | - |
| 63 | St. Louis County |
-0.37% |
- |
-3,716人 | 999,026人 | 49.1 | - |
| 64 | Webster County |
-0.40% |
- |
-144人 | 36,299人 | 48.7 | - |
| 65 | Texas County |
-0.40% |
- |
-104人 | 26,049人 | 48.7 | - |
| 66 | Warren County |
-0.42% |
- |
-138人 | 32,564人 | 48.3 | - |
| 67 | Clinton County |
-0.42% |
- |
-88人 | 20,735人 | 48.3 | - |
| 68 | Laclede County |
-0.44% |
- |
-156人 | 35,648人 | 48.1 | - |
| 69 | Ozark County |
-0.45% |
- |
-44人 | 9,730人 | 47.9 | - |
| 70 | Adair County |
-0.48% |
- |
-122人 | 25,597人 | 47.5 | - |
| 71 | Dent County |
-0.48% |
- |
-76人 | 15,706人 | 47.4 | - |
| 72 | Washington County |
-0.51% |
- |
-128人 | 25,174人 | 47.1 | - |
| 73 | Callaway County |
-0.53% |
- |
-235人 | 44,346人 | 46.7 | - |
| 74 | Morgan County |
-0.55% |
- |
-114人 | 20,572人 | 46.4 | - |
| 75 | Stoddard County |
-0.57% |
- |
-171人 | 30,006人 | 46.1 | - |
| 76 | Pemiscot County |
-0.58% |
- |
-105人 | 18,221人 | 46.0 | - |
| 77 | Jackson County |
-0.59% |
- |
-4,006人 | 675,055人 | 45.8 | - |
| 78 | Scott County |
-0.61% |
- |
-239人 | 39,228人 | 45.5 | - |
| 79 | Jasper County |
-0.61% |
- |
-721人 | 117,779人 | 45.5 | - |
| 80 | Harrison County |
-0.62% |
- |
-55人 | 8,940人 | 45.4 | - |
| 81 | Macon County |
-0.62% |
- |
-97人 | 15,584人 | 45.3 | - |
| 82 | Dade County |
-0.62% |
- |
-49人 | 7,865人 | 45.3 | - |
| 83 | New Madrid County |
-0.63% |
- |
-119人 | 18,924人 | 45.2 | - |
| 84 | Gasconade County |
-0.64% |
- |
-97人 | 15,230人 | 45.1 | - |
| 85 | Atchison County |
-0.66% |
- |
-37人 | 5,646人 | 44.8 | - |
| 86 | Wayne County |
-0.67% |
- |
-90人 | 13,523人 | 44.7 | - |
| 87 | Perry County |
-0.71% |
- |
-134人 | 18,978人 | 44.1 | - |
| 88 | Lafayette County |
-0.72% |
- |
-239人 | 33,421人 | 43.9 | - |
| 89 | Ray County |
-0.74% |
- |
-174人 | 23,455人 | 43.5 | - |
| 90 | Worth County |
-0.79% |
- |
-17人 | 2,154人 | 42.8 | - |
| 91 | Andrew County |
-0.80% |
- |
-138人 | 17,358人 | 42.7 | - |
| 92 | Barry County |
-0.81% |
- |
-290人 | 35,755人 | 42.5 | - |
| 93 | Vernon County |
-0.82% |
- |
-174人 | 21,111人 | 42.3 | - |
| 94 | Pettis County |
-0.85% |
- |
-359人 | 42,280人 | 41.9 | - |
| 95 | Pulaski County |
-0.85% |
- |
-451人 | 52,827人 | 41.9 | - |
| 96 | Phelps County |
-0.86% |
- |
-389人 | 45,291人 | 41.8 | - |
| 97 | St. Clair County |
-0.86% |
- |
-85人 | 9,830人 | 41.7 | - |
| 98 | Cedar County |
-0.89% |
- |
-124人 | 13,989人 | 41.4 | - |
| 99 | Sullivan County |
-0.89% |
- |
-60人 | 6,707人 | 41.2 | - |
| 100 | Saline County |
-0.96% |
- |
-224人 | 23,389人 | 40.3 | - |
| 101 | Randolph County |
-1.01% |
- |
-256人 | 25,431人 | 39.6 | - |
| 102 | Linn County |
-1.04% |
- |
-132人 | 12,735人 | 39.1 | - |
| 103 | St. Louis city |
-1.10% |
- |
-3,502人 | 319,102人 | 38.2 | - |
| 104 | Monroe County |
-1.15% |
- |
-101人 | 8,794人 | 37.4 | - |
| 105 | Camden County |
-1.18% |
- |
-521人 | 44,017人 | 36.9 | - |
| 106 | Iron County |
-1.20% |
- |
-127人 | 10,588人 | 36.7 | - |
| 107 | Chariton County |
-1.25% |
- |
-98人 | 7,834人 | 35.9 | - |
| 108 | Wright County |
-1.32% |
- |
-248人 | 18,851人 | 34.9 | - |
| 109 | Holt County |
-1.33% |
- |
-65人 | 4,893人 | 34.7 | - |
| 110 | McDonald County |
-1.42% |
- |
-328人 | 23,083人 | 33.3 | - |
| 111 | Schuyler County |
-1.46% |
- |
-65人 | 4,437人 | 32.7 | - |
| 112 | Clark County |
-1.52% |
- |
-108人 | 7,128人 | 31.9 | - |
| 113 | Daviess County |
-1.92% |
- |
-162人 | 8,439人 | 25.8 | - |
| 114 | Shelby County |
-2.07% |
- |
-132人 | 6,371人 | 23.5 | - |
| 115 | Caldwell County |
-2.62% |
- |
-247人 | 9,435人 | 15.3 | - |
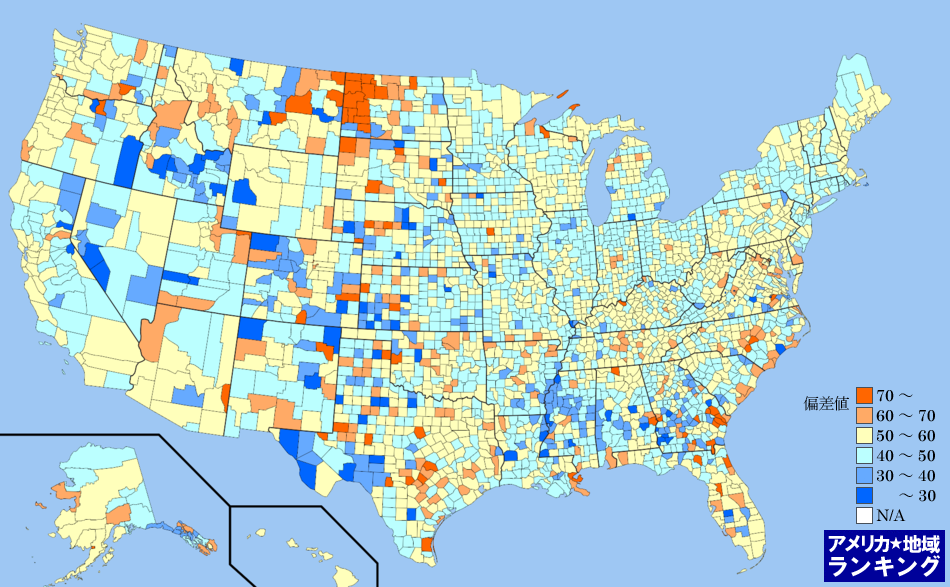
全米・人口にしめる国内からの移住割合(2010年7月~翌年6月末)ランキングマップ(郡別)
人口にしめる国内からの移住割合(2010年7月~翌年6月末)ランキング(郡別)の偏差値にしたがって色分けしたアメリカ合衆国の全郡マップです。アメリカ合衆国におけるすべての郡(州の下の地域区分)の平均と比べて、数値が高い地域はより赤く、数値が低い地域はより青く色分けしています。
アメリカ州のエリアをクリックしてください。その州内における郡のランキングページを表示します。