オハイオ州の失業者数ランキング
オハイオ州の88郡を対象とした失業者数についてのランキングです。アメリカ合衆国における「郡」(countyまたはcounty-equivalent)は、州(state)の下の行政区画です。

このランキングにおける失業者は、働ける状態にありながら4週間以上、仕事を探している人と定義されています。一時的に雇い止め(レイオフ)となっている人も含まれます。
企業を取り巻く法律や雇用慣習が日本と異なるため、失業者とする基準も日本と違う部分があります。
オハイオ州のランキングの1位はCuyahoga Countyの45,828人、2位はFranklin Countyの38,437人、3位はHamilton Countyの28,144人です。
オハイオ州のランキングの最下位(88位)はMonroe Countyの529人です。
このランキングには、ランキングマップがあります。偏差値にしたがって地図上の地域を色分けすることで、ひと目で失業者数の状況が分かるようになっています。
全米・失業者数ランキング(州別)や全米・失業者数ランキング(郡別)もあります。全米の郡別ランキングはサイズの大きなページとなるため、お使いのインターネット環境によっては、読み込みに時間がかかる場合があります。
オハイオ州のページではオハイオ州についてのすべてのランキング順位を確認できます。
| 順位 | 郡 | 失業者数 |
労働力人口 |
偏差値 | 評価 |
|---|
| 1 | Cuyahoga County |
45,828人 |
  |
625,471人 | 105.6 | - |
| 2 | Franklin County |
38,437人 |
|
625,762人 | 95.6 | - |
| 3 | Hamilton County |
28,144人 |
|
400,040人 | 81.7 | - |
| 4 | Montgomery County |
19,802人 |
|
252,776人 | 70.4 | - |
| 5 | Summit County |
19,195人 |
|
281,241人 | 69.6 | - |
| 6 | Lucas County |
16,734人 |
|
209,051人 | 66.3 | - |
| 7 | Stark County |
13,555人 |
|
184,597人 | 62.0 | - |
| 8 | Butler County |
13,428人 |
|
189,596人 | 61.8 | - |
| 9 | Lorain County |
12,072人 |
|
156,103人 | 60.0 | - |
| 10 | Mahoning County |
8,656人 |
|
110,913人 | 55.4 | - |
| 11 | Lake County |
8,266人 |
|
128,568人 | 54.8 | - |
| 12 | Trumbull County |
8,142人 |
|
100,367人 | 54.7 | - |
| 13 | Clermont County |
7,221人 |
|
104,870人 | 53.4 | - |
| 14 | Warren County |
6,854人 |
|
109,079人 | 52.9 | - |
| 15 | Portage County |
6,073人 |
|
90,936人 | 51.9 | - |
| 16 | Medina County |
5,757人 |
|
95,236人 | 51.4 | - |
| 17 | Licking County |
5,526人 |
|
84,829人 | 51.1 | - |
| 18 | Greene County |
5,506人 |
|
78,340人 | 51.1 | - |
| 19 | Clark County |
4,934人 |
|
67,726人 | 50.3 | - |
| 20 | Richland County |
4,803人 |
|
57,622人 | 50.1 | - |
| 21 | Delaware County |
4,785人 |
|
95,264人 | 50.1 | - |
| オハイオ州郡の平均 |
4,693人 |
- |
65,317人 | 50.0 | - |
| 22 | Fairfield County |
4,678人 |
|
74,834人 | 50.0 | - |
| 23 | Wood County |
4,558人 |
|
65,701人 | 49.8 | - |
| 24 | Ashtabula County |
4,249人 |
|
47,319人 | 49.4 | - |
| 25 | Columbiana County |
4,097人 |
|
51,528人 | 49.2 | - |
| 26 | Allen County |
3,793人 |
|
48,784人 | 48.8 | - |
| 27 | Miami County |
3,647人 |
|
52,408人 | 48.6 | - |
| 28 | Muskingum County |
3,588人 |
|
37,033人 | 48.5 | - |
| 29 | Wayne County |
3,465人 |
|
57,199人 | 48.3 | - |
| 30 | Scioto County |
3,416人 |
|
31,867人 | 48.3 | - |
| 31 | Jefferson County |
3,176人 |
|
30,815人 | 47.9 | - |
| 32 | Tuscarawas County |
3,152人 |
|
46,570人 | 47.9 | - |
| 33 | Erie County |
2,962人 |
|
40,622人 | 47.7 | - |
| 34 | Geauga County |
2,944人 |
|
49,347人 | 47.6 | - |
| 35 | Ross County |
2,861人 |
|
34,970人 | 47.5 | - |
| 36 | Huron County |
2,751人 |
|
26,990人 | 47.4 | - |
| 37 | Belmont County |
2,452人 |
|
33,011人 | 47.0 | - |
| 38 | Hancock County |
2,430人 |
|
39,657人 | 46.9 | - |
| 39 | Sandusky County |
2,298人 |
|
32,521人 | 46.8 | - |
| 40 | Marion County |
2,286人 |
|
29,761人 | 46.7 | - |
| 41 | Athens County |
2,257人 |
|
29,420人 | 46.7 | - |
| 42 | Washington County |
2,160人 |
|
31,170人 | 46.6 | - |
| 43 | Seneca County |
2,127人 |
|
28,493人 | 46.5 | - |
| 44 | Lawrence County |
2,106人 |
|
27,812人 | 46.5 | - |
| 45 | Ottawa County |
2,030人 |
|
20,819人 | 46.4 | - |
| 46 | Knox County |
2,020人 |
|
29,780人 | 46.4 | - |
| 47 | Ashland County |
1,973人 |
|
26,414人 | 46.3 | - |
| 48 | Brown County |
1,875人 |
|
21,396人 | 46.2 | - |
| 49 | Pickaway County |
1,851人 |
|
24,389人 | 46.2 | - |
| 50 | Darke County |
1,822人 |
|
27,097人 | 46.1 | - |
| 51 | Clinton County |
1,776人 |
|
17,222人 | 46.1 | - |
| 52 | Crawford County |
1,774人 |
|
20,391人 | 46.1 | - |
| 53 | Highland County |
1,765人 |
|
18,434人 | 46.0 | - |
| 54 | Fulton County |
1,696人 |
|
21,825人 | 45.9 | - |
| 55 | Shelby County |
1,658人 |
|
24,226人 | 45.9 | - |
| 56 | Coshocton County |
1,569人 |
|
15,830人 | 45.8 | - |
| 57 | Guernsey County |
1,559人 |
|
18,658人 | 45.8 | - |
| 58 | Preble County |
1,558人 |
|
20,437人 | 45.8 | - |
| 59 | Logan County |
1,555人 |
|
23,161人 | 45.8 | - |
| 60 | Perry County |
1,505人 |
|
15,888人 | 45.7 | - |
| 61 | Union County |
1,500人 |
|
27,087人 | 45.7 | - |
| 62 | Williams County |
1,448人 |
|
18,981人 | 45.6 | - |
| 63 | Auglaize County |
1,422人 |
|
25,580人 | 45.6 | - |
| 64 | Defiance County |
1,389人 |
|
19,114人 | 45.5 | - |
| 65 | Champaign County |
1,377人 |
|
19,430人 | 45.5 | - |
| 66 | Jackson County |
1,365人 |
|
14,778人 | 45.5 | - |
| 67 | Pike County |
1,328人 |
|
10,265人 | 45.4 | - |
| 68 | Madison County |
1,325人 |
|
20,041人 | 45.4 | - |
| 69 | Adams County |
1,307人 |
|
12,126人 | 45.4 | - |
| 70 | Morrow County |
1,246人 |
|
17,342人 | 45.3 | - |
| 71 | Henry County |
1,181人 |
|
15,143人 | 45.2 | - |
| 72 | Gallia County |
1,154人 |
|
12,936人 | 45.2 | - |
| 73 | Fayette County |
1,112人 |
|
15,567人 | 45.2 | - |
| 74 | Mercer County |
1,081人 |
|
24,831人 | 45.1 | - |
| 75 | Hocking County |
1,080人 |
|
13,698人 | 45.1 | - |
| 76 | Hardin County |
1,068人 |
|
14,279人 | 45.1 | - |
| 77 | Meigs County |
1,056人 |
|
8,958人 | 45.1 | - |
| 78 | Putnam County |
1,047人 |
|
17,588人 | 45.1 | - |
| 79 | Van Wert County |
1,031人 |
|
13,894人 | 45.0 | - |
| 80 | Carroll County |
1,026人 |
|
13,620人 | 45.0 | - |
| 81 | Holmes County |
968人 |
|
20,440人 | 45.0 | - |
| 82 | Wyandot County |
804人 |
|
11,047人 | 44.7 | - |
| 83 | Paulding County |
671人 |
|
9,772人 | 44.6 | - |
| 84 | Morgan County |
645人 |
|
5,798人 | 44.5 | - |
| 85 | Vinton County |
578人 |
|
5,461人 | 44.4 | - |
| 86 | Harrison County |
577人 |
|
7,082人 | 44.4 | - |
| 87 | Noble County |
554人 |
|
5,349人 | 44.4 | - |
| 88 | Monroe County |
529人 |
|
5,500人 | 44.4 | - |
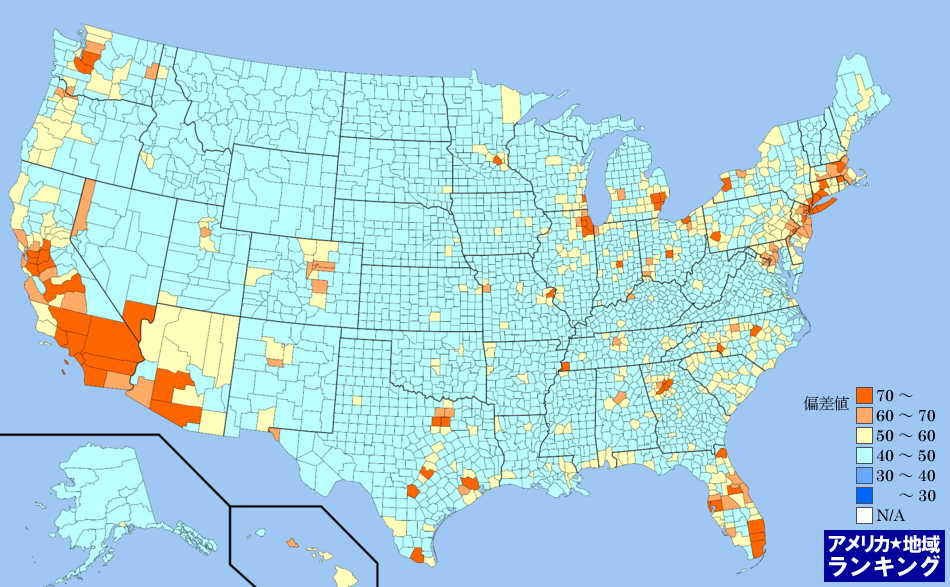
全米・失業者数ランキングマップ(郡別)
失業者数ランキング(郡別)の偏差値にしたがって色分けしたアメリカ合衆国の全郡マップです。アメリカ合衆国におけるすべての郡(州の下の地域区分)の平均と比べて、数値が高い地域はより赤く、数値が低い地域はより青く色分けしています。
アメリカ州のエリアをクリックしてください。その州内における郡のランキングページを表示します。