ケンタッキー州のヒスパニック・ラテン系人口ランキング
ケンタッキー州の120郡を対象としたヒスパニック・ラテン系人口についてのランキングです。アメリカ合衆国における「郡」(countyまたはcounty-equivalent)は、州(state)の下の行政区画です。
ケンタッキー州のランキングの1位はJefferson Countyの32,542人、2位はFayette Countyの20,474人、3位はHardin Countyの5,317人です。
ケンタッキー州のランキングの最下位(120位)はRobertson Countyの22人です。
このランキングには、ランキングマップがあります。偏差値にしたがって地図上の地域を色分けすることで、ひと目でヒスパニック・ラテン系人口の状況が分かるようになっています。
全米・ヒスパニック・ラテン系人口ランキング(州別)や全米・ヒスパニック・ラテン系人口ランキング(郡別)もあります。全米の郡別ランキングはサイズの大きなページとなるため、お使いのインターネット環境によっては、読み込みに時間がかかる場合があります。
ケンタッキー州のページではケンタッキー州についてのすべてのランキング順位を確認できます。
| 順位 | 郡 | ヒスパニック・ラテン系人口 |
人口(国勢調査) |
偏差値 | 評価 |
|---|
| 1 | Jefferson County |
32,542人 |
  |
741,096人 | 138.6 | - |
| 2 | Fayette County |
20,474人 |
|
295,803人 | 104.6 | - |
| 3 | Hardin County |
5,317人 |
|
105,543人 | 61.9 | - |
| 4 | Warren County |
5,174人 |
|
113,792人 | 61.5 | - |
| 5 | Christian County |
4,541人 |
|
73,955人 | 59.7 | - |
| 6 | Kenton County |
4,225人 |
|
159,720人 | 58.8 | - |
| 7 | Boone County |
4,205人 |
|
118,811人 | 58.7 | - |
| 8 | Shelby County |
3,812人 |
|
42,074人 | 57.6 | - |
| 9 | Daviess County |
2,525人 |
|
96,656人 | 54.0 | - |
| 10 | Oldham County |
2,133人 |
|
60,316人 | 52.9 | - |
| 11 | Graves County |
2,099人 |
|
37,121人 | 52.8 | - |
| 12 | Scott County |
1,994人 |
|
47,173人 | 52.5 | - |
| 13 | Madison County |
1,813人 |
|
82,916人 | 52.0 | - |
| 14 | Woodford County |
1,680人 |
|
24,939人 | 51.6 | - |
| 15 | Campbell County |
1,495人 |
|
90,336人 | 51.1 | - |
| 16 | McCracken County |
1,383人 |
|
65,565人 | 50.8 | - |
| 17 | Franklin County |
1,374人 |
|
49,285人 | 50.8 | - |
| 18 | Bourbon County |
1,368人 |
|
19,985人 | 50.7 | - |
| 19 | Jessamine County |
1,353人 |
|
48,586人 | 50.7 | - |
| 20 | Pulaski County |
1,318人 |
|
63,063人 | 50.6 | - |
| 21 | Barren County |
1,110人 |
|
42,173人 | 50.0 | - |
| ケンタッキー州郡の平均 |
1,107人 |
- |
36,161人 | 50.0 | - |
| 22 | Bullitt County |
1,038人 |
|
74,319人 | 49.8 | - |
| 23 | Clark County |
891人 |
|
35,613人 | 49.4 | - |
| 24 | Calloway County |
890人 |
|
37,191人 | 49.4 | - |
| 25 | Nelson County |
888人 |
|
43,437人 | 49.4 | - |
| 26 | Meade County |
859人 |
|
28,602人 | 49.3 | - |
| 27 | Henderson County |
858人 |
|
46,250人 | 49.3 | - |
| 28 | Ohio County |
844人 |
|
23,842人 | 49.3 | - |
| 29 | Boyle County |
796人 |
|
28,432人 | 49.1 | - |
| 30 | Carroll County |
789人 |
|
10,811人 | 49.1 | - |
| 31 | Hopkins County |
734人 |
|
46,920人 | 48.9 | - |
| 32 | Laurel County |
717人 |
|
58,849人 | 48.9 | - |
| 33 | Boyd County |
714人 |
|
49,542人 | 48.9 | - |
| 34 | Montgomery County |
660人 |
|
26,499人 | 48.7 | - |
| 35 | Logan County |
651人 |
|
26,835人 | 48.7 | - |
| 36 | Wayne County |
601人 |
|
20,813人 | 48.6 | - |
| 37 | Russell County |
585人 |
|
17,565人 | 48.5 | - |
| 38 | Webster County |
580人 |
|
13,621人 | 48.5 | - |
| 39 | Grant County |
577人 |
|
24,662人 | 48.5 | - |
| 40 | Todd County |
494人 |
|
12,460人 | 48.3 | - |
| 41 | Mercer County |
490人 |
|
21,331人 | 48.3 | - |
| 42 | Marion County |
482人 |
|
19,820人 | 48.2 | - |
| 43 | Henry County |
447人 |
|
15,416人 | 48.1 | - |
| 44 | Pike County |
446人 |
|
65,024人 | 48.1 | - |
| 45 | Taylor County |
433人 |
|
24,512人 | 48.1 | - |
| 46 | Garrard County |
403人 |
|
16,912人 | 48.0 | - |
| 47 | Clay County |
402人 |
|
21,730人 | 48.0 | - |
| 48 | Larue County |
401人 |
|
14,193人 | 48.0 | - |
| 49 | Washington County |
393人 |
|
11,717人 | 48.0 | - |
| 50 | McCreary County |
392人 |
|
18,306人 | 48.0 | - |
| 51 | Martin County |
388人 |
|
12,929人 | 48.0 | - |
| 52 | Casey County |
378人 |
|
15,955人 | 47.9 | - |
| 53 | Gallatin County |
372人 |
|
8,589人 | 47.9 | - |
| 53 | Lincoln County |
372人 |
|
24,742人 | 47.9 | - |
| 55 | Muhlenberg County |
367人 |
|
31,499人 | 47.9 | - |
| 56 | Marshall County |
350人 |
|
31,448人 | 47.9 | - |
| 57 | Harrison County |
337人 |
|
18,846人 | 47.8 | - |
| 58 | Simpson County |
325人 |
|
17,327人 | 47.8 | - |
| 59 | Butler County |
322人 |
|
12,690人 | 47.8 | - |
| 60 | Carter County |
321人 |
|
27,720人 | 47.8 | - |
| 61 | Adair County |
319人 |
|
18,656人 | 47.8 | - |
| 62 | Whitley County |
310人 |
|
35,637人 | 47.8 | - |
| 63 | Allen County |
297人 |
|
19,956人 | 47.7 | - |
| 64 | Rowan County |
294人 |
|
23,333人 | 47.7 | - |
| 65 | Monroe County |
289人 |
|
10,963人 | 47.7 | - |
| 66 | Anderson County |
288人 |
|
21,421人 | 47.7 | - |
| 67 | Greenup County |
284人 |
|
36,910人 | 47.7 | - |
| 68 | Knox County |
270人 |
|
31,883人 | 47.6 | - |
| 69 | Hart County |
261人 |
|
18,199人 | 47.6 | - |
| 70 | Grayson County |
258人 |
|
25,746人 | 47.6 | - |
| 71 | Mason County |
248人 |
|
17,490人 | 47.6 | - |
| 72 | Owen County |
246人 |
|
10,841人 | 47.6 | - |
| 73 | Union County |
243人 |
|
15,007人 | 47.6 | - |
| 74 | Spencer County |
239人 |
|
17,061人 | 47.6 | - |
| 75 | Clinton County |
231人 |
|
10,272人 | 47.5 | - |
| 76 | Trimble County |
223人 |
|
8,809人 | 47.5 | - |
| 77 | Floyd County |
219人 |
|
39,451人 | 47.5 | - |
| 78 | Harlan County |
210人 |
|
29,278人 | 47.5 | - |
| 79 | Bell County |
198人 |
|
28,691人 | 47.4 | - |
| 80 | Perry County |
185人 |
|
28,712人 | 47.4 | - |
| 81 | Breckinridge County |
175人 |
|
20,059人 | 47.4 | - |
| 81 | Trigg County |
175人 |
|
14,339人 | 47.4 | - |
| 83 | Green County |
159人 |
|
11,258人 | 47.3 | - |
| 84 | Bath County |
157人 |
|
11,591人 | 47.3 | - |
| 85 | Fleming County |
149人 |
|
14,348人 | 47.3 | - |
| 86 | Pendleton County |
143人 |
|
14,877人 | 47.3 | - |
| 87 | Powell County |
132人 |
|
12,613人 | 47.3 | - |
| 88 | Caldwell County |
129人 |
|
12,984人 | 47.2 | - |
| 89 | Letcher County |
124人 |
|
24,519人 | 47.2 | - |
| 90 | Livingston County |
123人 |
|
9,519人 | 47.2 | - |
| 91 | Metcalfe County |
115人 |
|
10,099人 | 47.2 | - |
| 92 | Johnson County |
109人 |
|
23,356人 | 47.2 | - |
| 93 | Morgan County |
108人 |
|
13,923人 | 47.2 | - |
| 94 | McLean County |
106人 |
|
9,531人 | 47.2 | - |
| 95 | Rockcastle County |
103人 |
|
17,056人 | 47.2 | - |
| 96 | Estill County |
101人 |
|
14,672人 | 47.2 | - |
| 97 | Edmonson County |
100人 |
|
12,161人 | 47.2 | - |
| 98 | Knott County |
99人 |
|
16,346人 | 47.2 | - |
| 99 | Nicholas County |
98人 |
|
7,135人 | 47.2 | - |
| 100 | Bracken County |
96人 |
|
8,488人 | 47.2 | - |
| 101 | Magoffin County |
95人 |
|
13,333人 | 47.1 | - |
| 102 | Hancock County |
94人 |
|
8,565人 | 47.1 | - |
| 103 | Ballard County |
90人 |
|
8,249人 | 47.1 | - |
| 104 | Breathitt County |
89人 |
|
13,878人 | 47.1 | - |
| 105 | Jackson County |
84人 |
|
13,494人 | 47.1 | - |
| 106 | Carlisle County |
83人 |
|
5,104人 | 47.1 | - |
| 107 | Lewis County |
78人 |
|
13,870人 | 47.1 | - |
| 108 | Lawrence County |
77人 |
|
15,860人 | 47.1 | - |
| 108 | Lyon County |
77人 |
|
8,314人 | 47.1 | - |
| 110 | Cumberland County |
63人 |
|
6,856人 | 47.1 | - |
| 111 | Elliott County |
62人 |
|
7,852人 | 47.1 | - |
| 112 | Lee County |
58人 |
|
7,887人 | 47.0 | - |
| 113 | Hickman County |
57人 |
|
4,902人 | 47.0 | - |
| 114 | Fulton County |
53人 |
|
6,813人 | 47.0 | - |
| 115 | Menifee County |
51人 |
|
6,306人 | 47.0 | - |
| 116 | Crittenden County |
48人 |
|
9,315人 | 47.0 | - |
| 117 | Wolfe County |
41人 |
|
7,355人 | 47.0 | - |
| 118 | Leslie County |
40人 |
|
11,310人 | 47.0 | - |
| 119 | Owsley County |
39人 |
|
4,755人 | 47.0 | - |
| 120 | Robertson County |
22人 |
|
2,282人 | 46.9 | - |
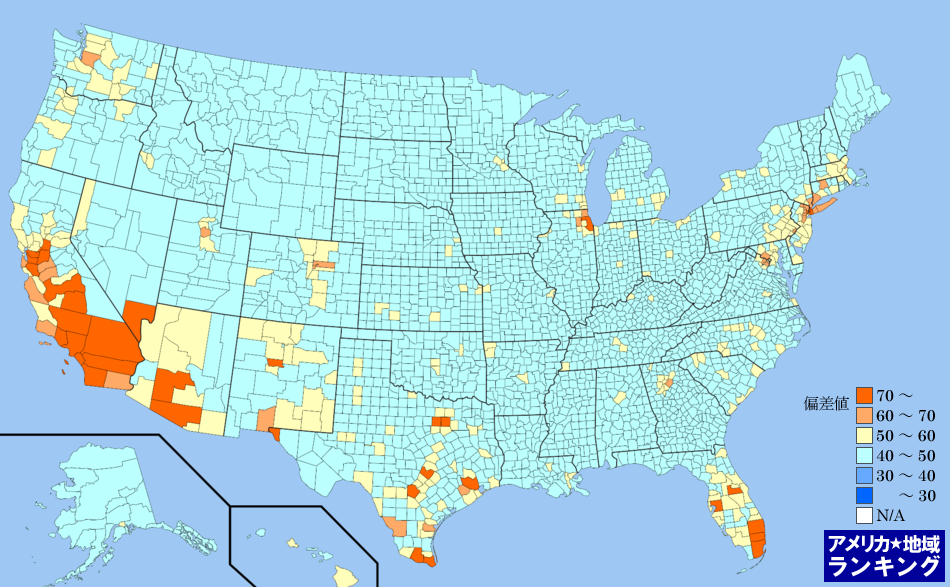
全米・ヒスパニック・ラテン系人口ランキングマップ(郡別)
ヒスパニック・ラテン系人口ランキング(郡別)の偏差値にしたがって色分けしたアメリカ合衆国の全郡マップです。アメリカ合衆国におけるすべての郡(州の下の地域区分)の平均と比べて、数値が高い地域はより赤く、数値が低い地域はより青く色分けしています。
アメリカ州のエリアをクリックしてください。その州内における郡のランキングページを表示します。