カンザス州のヒスパニック・ラテン系人口ランキング
カンザス州の105郡を対象としたヒスパニック・ラテン系人口についてのランキングです。アメリカ合衆国における「郡」(countyまたはcounty-equivalent)は、州(state)の下の行政区画です。
カンザス州のランキングの1位はSedgwick Countyの64,636人、2位はWyandotte Countyの41,633人、3位はJohnson Countyの38,949人です。
カンザス州のランキングの最下位(105位)はDecatur Countyの30人です。
このランキングには、ランキングマップがあります。偏差値にしたがって地図上の地域を色分けすることで、ひと目でヒスパニック・ラテン系人口の状況が分かるようになっています。
全米・ヒスパニック・ラテン系人口ランキング(州別)や全米・ヒスパニック・ラテン系人口ランキング(郡別)もあります。全米の郡別ランキングはサイズの大きなページとなるため、お使いのインターネット環境によっては、読み込みに時間がかかる場合があります。
カンザス州のページではカンザス州についてのすべてのランキング順位を確認できます。
| 順位 | 郡 | ヒスパニック・ラテン系人口 |
人口(国勢調査) |
偏差値 | 評価 |
|---|
| 1 | Sedgwick County |
64,636人 |
  |
498,365人 | 120.8 | - |
| 2 | Wyandotte County |
41,633人 |
|
157,505人 | 94.5 | - |
| 3 | Johnson County |
38,949人 |
|
544,179人 | 91.4 | - |
| 4 | Shawnee County |
19,303人 |
|
177,934人 | 68.9 | - |
| 5 | Ford County |
17,321人 |
|
33,848人 | 66.6 | - |
| 6 | Finney County |
17,182人 |
|
36,776人 | 66.4 | - |
| 7 | Seward County |
12,990人 |
|
22,952人 | 61.6 | - |
| 8 | Lyon County |
6,755人 |
|
33,690人 | 54.5 | - |
| 9 | Douglas County |
5,651人 |
|
110,826人 | 53.2 | - |
| 10 | Saline County |
5,403人 |
|
55,606人 | 52.9 | - |
| 11 | Reno County |
5,209人 |
|
64,511人 | 52.7 | - |
| 12 | Riley County |
4,610人 |
|
71,115人 | 52.0 | - |
| 13 | Leavenworth County |
4,308人 |
|
76,227人 | 51.7 | - |
| 14 | Geary County |
4,252人 |
|
34,362人 | 51.6 | - |
| 15 | Harvey County |
3,747人 |
|
34,684人 | 51.0 | - |
| 16 | Barton County |
3,683人 |
|
27,674人 | 50.9 | - |
| 17 | Grant County |
3,439人 |
|
7,829人 | 50.7 | - |
| 18 | Cowley County |
3,292人 |
|
36,311人 | 50.5 | - |
| カンザス州郡の平均 |
2,858人 |
- |
27,173人 | 50.0 | - |
| 19 | Butler County |
2,602人 |
|
65,880人 | 49.7 | - |
| 20 | Stevens County |
1,866人 |
|
5,724人 | 48.9 | - |
| 21 | Montgomery County |
1,844人 |
|
35,471人 | 48.8 | - |
| 22 | Crawford County |
1,762人 |
|
39,134人 | 48.7 | - |
| 23 | Ellis County |
1,299人 |
|
28,452人 | 48.2 | - |
| 24 | Haskell County |
1,149人 |
|
4,256人 | 48.0 | - |
| 25 | Kearny County |
1,135人 |
|
3,977人 | 48.0 | - |
| 26 | Sumner County |
1,097人 |
|
24,132人 | 48.0 | - |
| 27 | McPherson County |
1,025人 |
|
29,180人 | 47.9 | - |
| 28 | Rice County |
1,018人 |
|
10,083人 | 47.9 | - |
| 29 | Pottawatomie County |
957人 |
|
21,604人 | 47.8 | - |
| 30 | Franklin County |
937人 |
|
25,992人 | 47.8 | - |
| 31 | Labette County |
875人 |
|
21,607人 | 47.7 | - |
| 32 | Gray County |
855人 |
|
6,006人 | 47.7 | - |
| 33 | Miami County |
828人 |
|
32,787人 | 47.7 | - |
| 33 | Stanton County |
828人 |
|
2,235人 | 47.7 | - |
| 35 | Hamilton County |
827人 |
|
2,690人 | 47.7 | - |
| 36 | Dickinson County |
769人 |
|
19,754人 | 47.6 | - |
| 37 | Scott County |
753人 |
|
4,936人 | 47.6 | - |
| 38 | Neosho County |
686人 |
|
16,512人 | 47.5 | - |
| 39 | Meade County |
676人 |
|
4,575人 | 47.5 | - |
| 40 | Sherman County |
647人 |
|
6,010人 | 47.5 | - |
| 41 | Morton County |
623人 |
|
3,233人 | 47.4 | - |
| 42 | Wichita County |
550人 |
|
2,234人 | 47.4 | - |
| 43 | Edwards County |
534人 |
|
3,037人 | 47.3 | - |
| 44 | Stafford County |
529人 |
|
4,437人 | 47.3 | - |
| 45 | Pratt County |
525人 |
|
9,656人 | 47.3 | - |
| 46 | Pawnee County |
461人 |
|
6,973人 | 47.3 | - |
| 47 | Jackson County |
438人 |
|
13,462人 | 47.2 | - |
| 48 | Cherokee County |
424人 |
|
21,603人 | 47.2 | - |
| 49 | Allen County |
392人 |
|
13,371人 | 47.2 | - |
| 50 | Atchison County |
383人 |
|
16,924人 | 47.2 | - |
| 51 | Thomas County |
370人 |
|
7,900人 | 47.1 | - |
| 52 | Jefferson County |
339人 |
|
19,126人 | 47.1 | - |
| 53 | Osage County |
330人 |
|
16,295人 | 47.1 | - |
| 54 | Ellsworth County |
322人 |
|
6,497人 | 47.1 | - |
| 55 | Bourbon County |
309人 |
|
15,173人 | 47.1 | - |
| 56 | Brown County |
306人 |
|
9,984人 | 47.1 | - |
| 57 | Harper County |
298人 |
|
6,034人 | 47.1 | - |
| 58 | Marion County |
296人 |
|
12,660人 | 47.1 | - |
| 59 | Cloud County |
283人 |
|
9,533人 | 47.0 | - |
| 60 | Norton County |
240人 |
|
5,671人 | 47.0 | - |
| 61 | Ness County |
229人 |
|
3,107人 | 47.0 | - |
| 62 | Greenwood County |
220人 |
|
6,689人 | 47.0 | - |
| 63 | Wilson County |
217人 |
|
9,409人 | 47.0 | - |
| 64 | Morris County |
212人 |
|
5,923人 | 47.0 | - |
| 65 | Wabaunsee County |
205人 |
|
7,053人 | 47.0 | - |
| 66 | Kingman County |
199人 |
|
7,858人 | 47.0 | - |
| 67 | Marshall County |
193人 |
|
10,117人 | 46.9 | - |
| 68 | Linn County |
186人 |
|
9,656人 | 46.9 | - |
| 69 | Coffey County |
176人 |
|
8,601人 | 46.9 | - |
| 70 | Greeley County |
171人 |
|
1,247人 | 46.9 | - |
| 71 | Doniphan County |
165人 |
|
7,945人 | 46.9 | - |
| 72 | Clark County |
163人 |
|
2,215人 | 46.9 | - |
| 73 | Clay County |
162人 |
|
8,535人 | 46.9 | - |
| 74 | Washington County |
144人 |
|
5,799人 | 46.9 | - |
| 75 | Cheyenne County |
142人 |
|
2,726人 | 46.9 | - |
| 76 | Anderson County |
123人 |
|
8,102人 | 46.9 | - |
| 77 | Nemaha County |
121人 |
|
10,178人 | 46.9 | - |
| 77 | Phillips County |
121人 |
|
5,642人 | 46.9 | - |
| 77 | Ottawa County |
121人 |
|
6,091人 | 46.9 | - |
| 80 | Barber County |
119人 |
|
4,861人 | 46.9 | - |
| 81 | Hodgeman County |
118人 |
|
1,916人 | 46.9 | - |
| 82 | Russell County |
115人 |
|
6,970人 | 46.9 | - |
| 83 | Wallace County |
108人 |
|
1,485人 | 46.8 | - |
| 84 | Rooks County |
107人 |
|
5,181人 | 46.8 | - |
| 85 | Chase County |
100人 |
|
2,790人 | 46.8 | - |
| 86 | Kiowa County |
99人 |
|
2,553人 | 46.8 | - |
| 87 | Chautauqua County |
87人 |
|
3,669人 | 46.8 | - |
| 88 | Sheridan County |
84人 |
|
2,556人 | 46.8 | - |
| 88 | Rush County |
84人 |
|
3,307人 | 46.8 | - |
| 90 | Rawlins County |
80人 |
|
2,519人 | 46.8 | - |
| 90 | Logan County |
80人 |
|
2,756人 | 46.8 | - |
| 92 | Elk County |
79人 |
|
2,882人 | 46.8 | - |
| 93 | Lane County |
74人 |
|
1,750人 | 46.8 | - |
| 94 | Comanche County |
73人 |
|
1,891人 | 46.8 | - |
| 94 | Mitchell County |
73人 |
|
6,373人 | 46.8 | - |
| 96 | Lincoln County |
72人 |
|
3,241人 | 46.8 | - |
| 97 | Woodson County |
69人 |
|
3,309人 | 46.8 | - |
| 98 | Jewell County |
63人 |
|
3,077人 | 46.8 | - |
| 99 | Graham County |
59人 |
|
2,597人 | 46.8 | - |
| 100 | Smith County |
57人 |
|
3,853人 | 46.8 | - |
| 101 | Republic County |
53人 |
|
4,980人 | 46.8 | - |
| 102 | Trego County |
51人 |
|
3,001人 | 46.8 | - |
| 103 | Osborne County |
46人 |
|
3,858人 | 46.8 | - |
| 104 | Gove County |
42人 |
|
2,695人 | 46.8 | - |
| 105 | Decatur County |
30人 |
|
2,961人 | 46.8 | - |
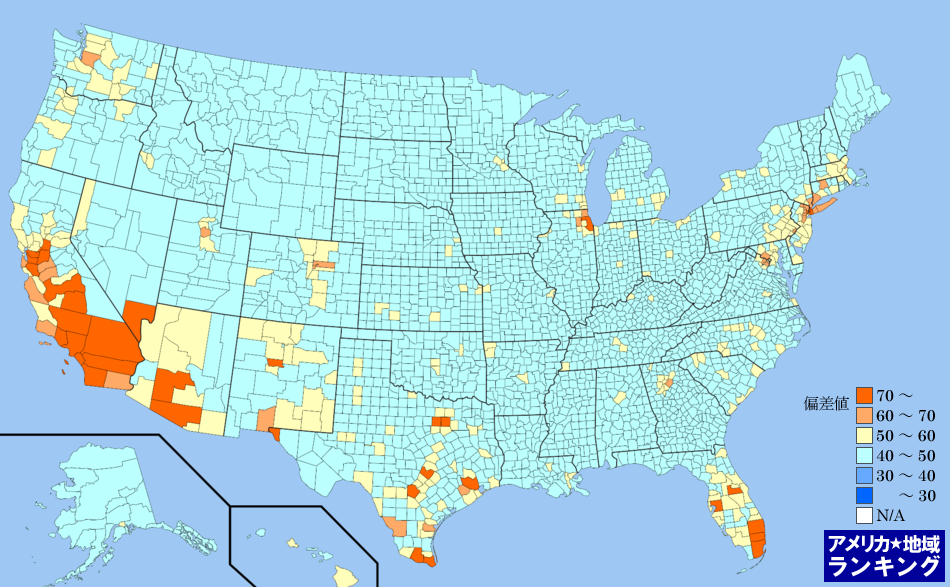
全米・ヒスパニック・ラテン系人口ランキングマップ(郡別)
ヒスパニック・ラテン系人口ランキング(郡別)の偏差値にしたがって色分けしたアメリカ合衆国の全郡マップです。アメリカ合衆国におけるすべての郡(州の下の地域区分)の平均と比べて、数値が高い地域はより赤く、数値が低い地域はより青く色分けしています。
アメリカ州のエリアをクリックしてください。その州内における郡のランキングページを表示します。