オハイオ州の移住者数ランキング
| 順位 | 郡 | 移住者数(2010年7月~翌年6月末) |
人口(推計) |
偏差値 | 評価 |
|---|
| 1 | Franklin County |
4,731人 |
  |
1,166,026人 | 87.0 | - |
| 2 | Delaware County |
2,074人 |
|
175,265人 | 67.3 | - |
| 3 | Greene County |
1,175人 |
|
161,625人 | 60.6 | - |
| 4 | Wood County |
1,007人 |
|
125,503人 | 59.4 | - |
| 5 | Warren County |
868人 |
|
213,269人 | 58.3 | - |
| 6 | Fairfield County |
398人 |
|
146,385人 | 54.8 | - |
| 7 | Union County |
356人 |
|
52,359人 | 54.5 | - |
| 8 | Medina County |
339人 |
|
172,565人 | 54.4 | - |
| 9 | Hancock County |
188人 |
|
74,687人 | 53.3 | - |
| 10 | Miami County |
173人 |
|
102,450人 | 53.2 | - |
| 11 | Pickaway County |
159人 |
|
55,816人 | 53.1 | - |
| 12 | Knox County |
152人 |
|
61,026人 | 53.0 | - |
| 13 | Portage County |
134人 |
|
161,403人 | 52.9 | - |
| 14 | Ottawa County |
113人 |
|
41,397人 | 52.7 | - |
| 15 | Monroe County |
106人 |
|
14,577人 | 52.7 | - |
| 16 | Perry County |
72人 |
|
36,060人 | 52.4 | - |
| 17 | Wyandot County |
48人 |
|
22,590人 | 52.2 | - |
| 18 | Belmont County |
36人 |
|
70,352人 | 52.1 | - |
| 19 | Carroll County |
33人 |
|
28,800人 | 52.1 | - |
| 20 | Morgan County |
32人 |
|
15,057人 | 52.1 | - |
| 21 | Harrison County |
25人 |
|
15,857人 | 52.1 | - |
| 22 | Lawrence County |
18人 |
|
62,406人 | 52.0 | - |
| 23 | Washington County |
10人 |
|
61,706人 | 52.0 | - |
| 23 | Williams County |
10人 |
|
37,535人 | 52.0 | - |
| 25 | Hocking County |
-2人 |
|
29,391人 | 51.9 | - |
| 26 | Licking County |
-13人 |
|
166,746人 | 51.8 | - |
| 27 | Marion County |
-15人 |
|
66,459人 | 51.8 | - |
| 28 | Clinton County |
-17人 |
|
41,890人 | 51.8 | - |
| 29 | Morrow County |
-23人 |
|
34,827人 | 51.7 | - |
| 30 | Meigs County |
-27人 |
- |
23,730人 | 51.7 | - |
| 31 | Vinton County |
-29人 |
- |
13,426人 | 51.7 | - |
| 32 | Coshocton County |
-32人 |
- |
36,897人 | 51.6 | - |
| 33 | Noble County |
-43人 |
- |
14,637人 | 51.6 | - |
| 34 | Van Wert County |
-44人 |
- |
28,671人 | 51.6 | - |
| 35 | Clermont County |
-53人 |
- |
197,759人 | 51.5 | - |
| 36 | Henry County |
-59人 |
- |
28,110人 | 51.4 | - |
| 37 | Lake County |
-60人 |
- |
230,054人 | 51.4 | - |
| 38 | Muskingum County |
-75人 |
- |
86,200人 | 51.3 | - |
| 39 | Ashland County |
-76人 |
- |
53,161人 | 51.3 | - |
| 40 | Pike County |
-107人 |
- |
28,721人 | 51.1 | - |
| 41 | Jackson County |
-115人 |
- |
33,269人 | 51.0 | - |
| 42 | Gallia County |
-122人 |
- |
30,971人 | 51.0 | - |
| 43 | Adams County |
-123人 |
- |
28,584人 | 51.0 | - |
| 44 | Mercer County |
-133人 |
- |
40,780人 | 50.9 | - |
| 45 | Fayette County |
-142人 |
- |
29,030人 | 50.8 | - |
| 46 | Preble County |
-151人 |
- |
42,181人 | 50.8 | - |
| 47 | Guernsey County |
-165人 |
- |
40,032人 | 50.7 | - |
| 48 | Wayne County |
-167人 |
- |
114,480人 | 50.6 | - |
| 49 | Athens County |
-183人 |
- |
64,805人 | 50.5 | - |
| 50 | Holmes County |
-193人 |
- |
42,448人 | 50.4 | - |
| 51 | Tuscarawas County |
-201人 |
- |
92,565人 | 50.4 | - |
| 52 | Defiance County |
-205人 |
- |
39,005人 | 50.4 | - |
| 53 | Logan County |
-212人 |
- |
45,797人 | 50.3 | - |
| 54 | Brown County |
-214人 |
- |
44,867人 | 50.3 | - |
| 55 | Paulding County |
-217人 |
- |
19,583人 | 50.3 | - |
| 56 | Champaign County |
-219人 |
- |
40,003人 | 50.3 | - |
| 57 | Putnam County |
-250人 |
- |
34,439人 | 50.0 | - |
| オハイオ州郡の平均 |
-253人 |
- |
131,117人 | 50.0 | - |
| 58 | Geauga County |
-254人 |
- |
93,398人 | 50.0 | - |
| 59 | Highland County |
-255人 |
- |
43,584人 | 50.0 | - |
| 60 | Scioto County |
-256人 |
- |
79,534人 | 50.0 | - |
| 61 | Shelby County |
-260人 |
- |
49,345人 | 49.9 | - |
| 62 | Seneca County |
-263人 |
- |
56,632人 | 49.9 | - |
| 63 | Erie County |
-267人 |
- |
77,042人 | 49.9 | - |
| 64 | Fulton County |
-268人 |
- |
42,640人 | 49.9 | - |
| 65 | Auglaize County |
-276人 |
- |
45,921人 | 49.8 | - |
| 66 | Ashtabula County |
-281人 |
- |
101,425人 | 49.8 | - |
| 67 | Lorain County |
-302人 |
- |
301,533人 | 49.6 | - |
| 68 | Hardin County |
-308人 |
- |
32,086人 | 49.6 | - |
| 69 | Sandusky County |
-326人 |
- |
60,873人 | 49.5 | - |
| 69 | Darke County |
-326人 |
- |
52,973人 | 49.5 | - |
| 71 | Huron County |
-370人 |
- |
59,596人 | 49.1 | - |
| 72 | Jefferson County |
-378人 |
- |
69,593人 | 49.1 | - |
| 73 | Madison County |
-380人 |
- |
43,420人 | 49.1 | - |
| 74 | Butler County |
-401人 |
- |
368,814人 | 48.9 | - |
| 75 | Clark County |
-416人 |
- |
138,232人 | 48.8 | - |
| 76 | Crawford County |
-439人 |
- |
43,757人 | 48.6 | - |
| 77 | Columbiana County |
-456人 |
- |
107,820人 | 48.5 | - |
| 78 | Ross County |
-457人 |
- |
78,093人 | 48.5 | - |
| 79 | Trumbull County |
-644人 |
- |
209,950人 | 47.1 | - |
| 80 | Allen County |
-659人 |
- |
106,222人 | 47.0 | - |
| 81 | Summit County |
-857人 |
- |
541,652人 | 45.5 | - |
| 82 | Mahoning County |
-868人 |
- |
238,339人 | 45.4 | - |
| 83 | Stark County |
-990人 |
- |
375,417人 | 44.5 | - |
| 84 | Richland County |
-1,152人 |
- |
124,195人 | 43.3 | - |
| 85 | Montgomery County |
-1,581人 |
- |
535,905人 | 40.1 | - |
| 86 | Lucas County |
-2,885人 |
- |
441,565人 | 30.4 | - |
| 87 | Hamilton County |
-4,421人 |
- |
802,034人 | 19.0 | - |
| 88 | Cuyahoga County |
-9,827人 |
- |
1,278,466人 | -21.1 | - |
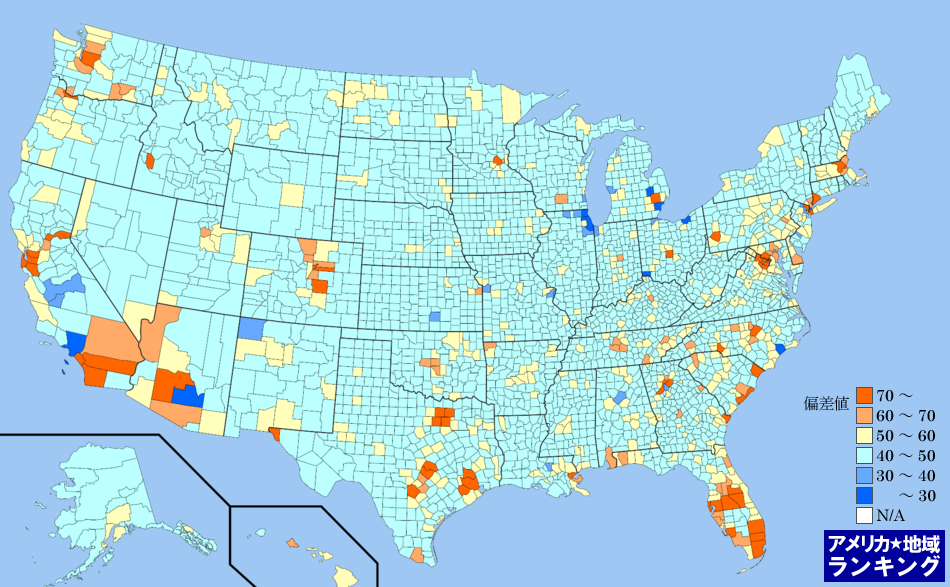
全米・移住者数(2010年7月~翌年6月末)ランキングマップ(郡別)
移住者数(2010年7月~翌年6月末)ランキング(郡別)の偏差値にしたがって色分けしたアメリカ合衆国の全郡マップです。アメリカ合衆国におけるすべての郡(州の下の地域区分)の平均と比べて、数値が高い地域はより赤く、数値が低い地域はより青く色分けしています。
アメリカ州のエリアをクリックしてください。その州内における郡のランキングページを表示します。