ミズーリ州の外国からの移住ランキング
ミズーリ州の115郡を対象とした外国からの移住(2010年7月~翌年6月末)についてのランキングです。アメリカ合衆国における「郡」(countyまたはcounty-equivalent)は、州(state)の下の行政区画です。

「外国からの移住」は、アメリカ合衆国外からその地域への移住者数を示します。プラスの場合は国外からその地域への転入を、マイナスの場合はその地域から国外への転出を表します。
ミズーリ州のランキングの1位はSt. Louis Countyの1,919人、2位はSt. Louis cityの1,013人、3位はJackson Countyの836人です。
ミズーリ州のランキングの最下位(115位)はStone Countyの-7人です。
このランキングには、ランキングマップがあります。偏差値にしたがって地図上の地域を色分けすることで、ひと目で外国からの移住(2010年7月~翌年6月末)の状況が分かるようになっています。
全米・外国からの移住(2010年7月~翌年6月末)ランキング(州別)や全米・外国からの移住(2010年7月~翌年6月末)ランキング(郡別)もあります。全米の郡別ランキングはサイズの大きなページとなるため、お使いのインターネット環境によっては、読み込みに時間がかかる場合があります。
ミズーリ州のページではミズーリ州についてのすべてのランキング順位を確認できます。
| 順位 | 郡 | 外国からの移住(2010年7月~翌年6月末) |
人口(推計) |
偏差値 | 評価 |
|---|
| 1 | St. Louis County |
1,919人 |
  |
999,026人 | 134.0 | - |
| 2 | St. Louis city |
1,013人 |
|
319,102人 | 93.1 | - |
| 3 | Jackson County |
836人 |
|
675,055人 | 85.2 | - |
| 4 | Boone County |
544人 |
|
163,222人 | 72.0 | - |
| 5 | St. Charles County |
342人 |
|
361,745人 | 62.9 | - |
| 6 | Clay County |
283人 |
|
222,729人 | 60.2 | - |
| 7 | Greene County |
205人 |
|
275,442人 | 56.7 | - |
| 8 | Platte County |
107人 |
|
89,729人 | 52.3 | - |
| 9 | Phelps County |
105人 |
|
45,291人 | 52.2 | - |
| 10 | Jefferson County |
95人 |
|
219,092人 | 51.7 | - |
| 11 | Pulaski County |
87人 |
|
52,827人 | 51.4 | - |
| 12 | Cole County |
83人 |
|
76,111人 | 51.2 | - |
| 13 | Taney County |
68人 |
|
51,908人 | 50.5 | - |
| 14 | Johnson County |
64人 |
|
52,701人 | 50.3 | - |
| 15 | Buchanan County |
63人 |
|
89,062人 | 50.3 | - |
| 16 | Jasper County |
58人 |
|
117,779人 | 50.1 | - |
| ミズーリ州郡の平均 |
57人 |
- |
52,140人 | 50.0 | - |
| 17 | Nodaway County |
43人 |
|
23,380人 | 49.4 | - |
| 18 | Newton County |
40人 |
|
58,124人 | 49.2 | - |
| 19 | Pettis County |
38人 |
|
42,280人 | 49.1 | - |
| 20 | Adair County |
36人 |
|
25,597人 | 49.1 | - |
| 21 | Howell County |
35人 |
|
40,584人 | 49.0 | - |
| 21 | Christian County |
35人 |
|
77,871人 | 49.0 | - |
| 23 | Saline County |
29人 |
|
23,389人 | 48.7 | - |
| 24 | Vernon County |
28人 |
|
21,111人 | 48.7 | - |
| 25 | Camden County |
27人 |
|
44,017人 | 48.7 | - |
| 26 | Miller County |
21人 |
|
24,728人 | 48.4 | - |
| 27 | Cass County |
20人 |
|
99,743人 | 48.3 | - |
| 28 | Franklin County |
19人 |
|
101,535人 | 48.3 | - |
| 29 | DeKalb County |
17人 |
|
12,863人 | 48.2 | - |
| 29 | Cape Girardeau County |
17人 |
|
75,848人 | 48.2 | - |
| 31 | Polk County |
16人 |
|
31,137人 | 48.2 | - |
| 32 | Scott County |
15人 |
|
39,228人 | 48.1 | - |
| 33 | McDonald County |
12人 |
|
23,083人 | 48.0 | - |
| 34 | Carroll County |
11人 |
|
9,280人 | 47.9 | - |
| 34 | Perry County |
11人 |
|
18,978人 | 47.9 | - |
| 34 | Madison County |
11人 |
|
12,190人 | 47.9 | - |
| 37 | Randolph County |
10人 |
|
25,431人 | 47.9 | - |
| 37 | Dent County |
10人 |
|
15,706人 | 47.9 | - |
| 39 | Barton County |
9人 |
|
12,377人 | 47.8 | - |
| 39 | Dunklin County |
9人 |
|
31,919人 | 47.8 | - |
| 39 | Lawrence County |
9人 |
|
38,602人 | 47.8 | - |
| 42 | Howard County |
8人 |
|
10,129人 | 47.8 | - |
| 42 | Butler County |
8人 |
|
42,820人 | 47.8 | - |
| 44 | Lewis County |
7人 |
|
10,192人 | 47.8 | - |
| 44 | Benton County |
7人 |
|
19,108人 | 47.8 | - |
| 44 | Linn County |
7人 |
|
12,735人 | 47.8 | - |
| 44 | Sullivan County |
7人 |
|
6,707人 | 47.8 | - |
| 48 | Pike County |
6人 |
|
18,486人 | 47.7 | - |
| 48 | Wright County |
6人 |
|
18,851人 | 47.7 | - |
| 48 | Webster County |
6人 |
|
36,299人 | 47.7 | - |
| 51 | St. Francois County |
5人 |
|
65,563人 | 47.7 | - |
| 51 | Chariton County |
5人 |
|
7,834人 | 47.7 | - |
| 51 | Audrain County |
5人 |
|
25,468人 | 47.7 | - |
| 51 | Lafayette County |
5人 |
|
33,421人 | 47.7 | - |
| 51 | Grundy County |
5人 |
|
10,267人 | 47.7 | - |
| 51 | Barry County |
5人 |
|
35,755人 | 47.7 | - |
| 57 | Montgomery County |
4人 |
|
12,241人 | 47.6 | - |
| 57 | Stoddard County |
4人 |
|
30,006人 | 47.6 | - |
| 59 | Warren County |
3人 |
|
32,564人 | 47.6 | - |
| 59 | Henry County |
3人 |
|
22,257人 | 47.6 | - |
| 59 | Pemiscot County |
3人 |
|
18,221人 | 47.6 | - |
| 59 | Clinton County |
3人 |
|
20,735人 | 47.6 | - |
| 59 | Gasconade County |
3人 |
|
15,230人 | 47.6 | - |
| 59 | Harrison County |
3人 |
|
8,940人 | 47.6 | - |
| 65 | Ozark County |
2人 |
|
9,730人 | 47.5 | - |
| 65 | Gentry County |
2人 |
|
6,727人 | 47.5 | - |
| 65 | Mississippi County |
2人 |
|
14,333人 | 47.5 | - |
| 65 | Marion County |
2人 |
|
28,776人 | 47.5 | - |
| 65 | Lincoln County |
2人 |
|
52,684人 | 47.5 | - |
| 65 | Texas County |
2人 |
|
26,049人 | 47.5 | - |
| 65 | Moniteau County |
2人 |
|
15,637人 | 47.5 | - |
| 65 | St. Clair County |
2人 |
|
9,830人 | 47.5 | - |
| 65 | Iron County |
2人 |
|
10,588人 | 47.5 | - |
| 65 | New Madrid County |
2人 |
|
18,924人 | 47.5 | - |
| 65 | Mercer County |
2人 |
|
3,777人 | 47.5 | - |
| 65 | Shannon County |
2人 |
|
8,437人 | 47.5 | - |
| 65 | Clark County |
2人 |
|
7,128人 | 47.5 | - |
| 78 | Cooper County |
1人 |
|
17,573人 | 47.5 | - |
| 78 | Livingston County |
1人 |
|
15,145人 | 47.5 | - |
| 78 | Ripley County |
1人 |
|
14,112人 | 47.5 | - |
| 78 | Caldwell County |
1人 |
|
9,435人 | 47.5 | - |
| 78 | Daviess County |
1人 |
|
8,439人 | 47.5 | - |
| 78 | Maries County |
1人 |
|
9,185人 | 47.5 | - |
| 78 | Crawford County |
1人 |
|
24,625人 | 47.5 | - |
| 78 | Morgan County |
1人 |
|
20,572人 | 47.5 | - |
| 78 | Ray County |
1人 |
|
23,455人 | 47.5 | - |
| 78 | Oregon County |
1人 |
|
10,929人 | 47.5 | - |
| 78 | Macon County |
1人 |
|
15,584人 | 47.5 | - |
| 78 | Holt County |
1人 |
|
4,893人 | 47.5 | - |
| 90 | Douglas County |
0人 |
|
13,643人 | 47.4 | - |
| 90 | Schuyler County |
0人 |
|
4,437人 | 47.4 | - |
| 90 | Knox County |
0人 |
|
4,127人 | 47.4 | - |
| 90 | Shelby County |
0人 |
|
6,371人 | 47.4 | - |
| 90 | Worth County |
0人 |
|
2,154人 | 47.4 | - |
| 90 | Atchison County |
0人 |
|
5,646人 | 47.4 | - |
| 90 | Scotland County |
0人 |
|
4,833人 | 47.4 | - |
| 90 | Washington County |
0人 |
|
25,174人 | 47.4 | - |
| 90 | Carter County |
0人 |
|
6,301人 | 47.4 | - |
| 90 | Hickory County |
0人 |
|
9,638人 | 47.4 | - |
| 90 | Dade County |
0人 |
|
7,865人 | 47.4 | - |
| 90 | Putnam County |
0人 |
|
4,971人 | 47.4 | - |
| 90 | Wayne County |
0人 |
|
13,523人 | 47.4 | - |
| 90 | Reynolds County |
0人 |
|
6,690人 | 47.4 | - |
| 90 | Osage County |
0人 |
|
13,870人 | 47.4 | - |
| 90 | Monroe County |
0人 |
|
8,794人 | 47.4 | - |
| 90 | Ste. Genevieve County |
0人 |
|
18,127人 | 47.4 | - |
| 90 | Ralls County |
0人 |
|
10,183人 | 47.4 | - |
| 90 | Bollinger County |
0人 |
|
12,339人 | 47.4 | - |
| 109 | Andrew County |
-1人 |
|
17,358人 | 47.4 | - |
| 110 | Cedar County |
-2人 |
|
13,989人 | 47.3 | - |
| 110 | Laclede County |
-2人 |
|
35,648人 | 47.3 | - |
| 110 | Callaway County |
-2人 |
|
44,346人 | 47.3 | - |
| 110 | Bates County |
-2人 |
|
17,050人 | 47.3 | - |
| 110 | Dallas County |
-2人 |
|
16,749人 | 47.3 | - |
| 115 | Stone County |
-7人 |
|
32,048人 | 47.1 | - |
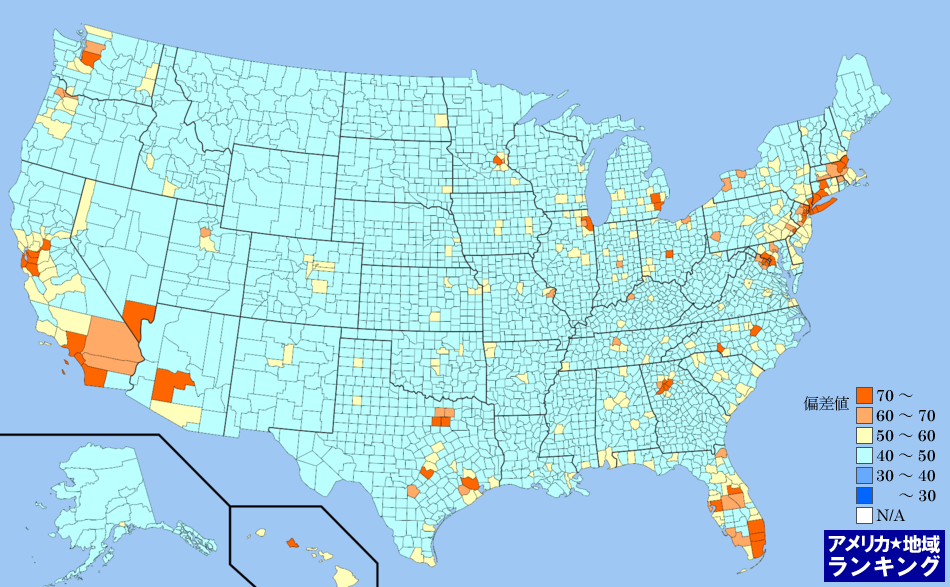
全米・外国からの移住(2010年7月~翌年6月末)ランキングマップ(郡別)
外国からの移住(2010年7月~翌年6月末)ランキング(郡別)の偏差値にしたがって色分けしたアメリカ合衆国の全郡マップです。アメリカ合衆国におけるすべての郡(州の下の地域区分)の平均と比べて、数値が高い地域はより赤く、数値が低い地域はより青く色分けしています。
アメリカ州のエリアをクリックしてください。その州内における郡のランキングページを表示します。