アメリカ地域ランキング - State and County Rankings in America

ホーム > 国内からの移住 > カンザス州(郡別)

カンザス州の国内からの移住ランキング

カテゴリ人口の変化 > 国内からの人口移動

カンザス州の105郡を対象とした国内からの移住(2011年7月~翌年6月末)についてのランキングです。アメリカ合衆国における「郡」(countyまたはcounty-equivalent)は、州(state)の下の行政区画です。

カンザス州の州旗

「国内からの移住」は、アメリカ合衆国内からその地域への移住者数を示します。プラスの場合は国内の他の地域からその地域への転入を、マイナスの場合はその地域から国内の他の地域への転出を表します。

カンザス州のランキングの1位はJohnson Countyの1,932人、2位はGeary Countyの1,384人、3位はRiley Countyの705人です。

カンザス州のランキングの最下位(105位)はSedgwick Countyの-1,729人です。

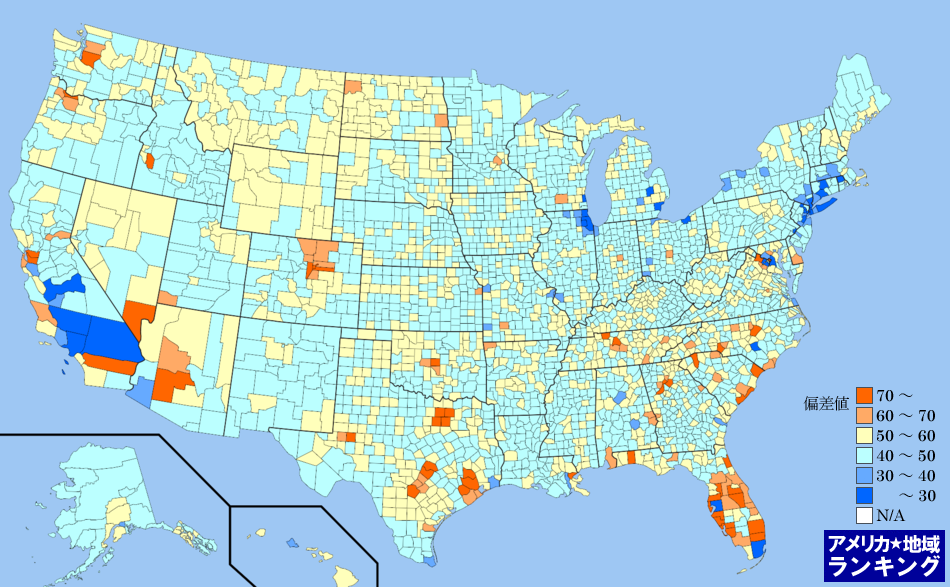
このランキングには、ランキングマップがあります。偏差値にしたがって地図上の地域を色分けすることで、ひと目で国内からの移住(2011年7月~翌年6月末)の状況が分かるようになっています。

全米・国内からの移住(2011年7月~翌年6月末)ランキング(州別)全米・国内からの移住(2011年7月~翌年6月末)ランキング(郡別)もあります。全米の郡別ランキングはサイズの大きなページとなるため、お使いのインターネット環境によっては、読み込みに時間がかかる場合があります。

カンザス州のページではカンザス州についてのすべてのランキング順位を確認できます。

順位国内からの移住(2011年7月~翌年6月末) 国内からの移住(2010年7月~翌年6月末) 偏差値評価
【情報源と計算式】国内からの移住(2011年7月~翌年6月末):米国勢調査局 2012年 国内からの移住(2010年7月~翌年6月末):米国勢調査局 2011年
1Johnson County 1,932 100%100% 2,017109.9-
2Geary County 1,384 72%72% -95993.4-
3Riley County 705 36%36% 45272.9-
4McPherson County 142 7%7% 6955.9-
5Ellis County 135 7%7% 14255.7-
6Pottawatomie County 91 5%5% 4854.4-
7Sherman County 87 5%5% 2654.2-
8Mitchell County 79 4% -2654.0-
9Pratt County 71 4% -1253.8-
10Stevens County 65 3% -17553.6-
11Clark County 55 3% -6753.3-
12Dickinson County 54 3% -9953.2-
13Marshall County 48 2% -8553.1-
14Gove County 39 2% 152.8-
15Rooks County 29 2% 2352.5-
16Cloud County 26 1% -13052.4-
17Comanche County 24 1% 352.3-
18Ellsworth County 23 1% -1852.3-
19Rush County 16 1% -10952.1-
20Greeley County 15 1% -752.1-
20Allen County 15 1% 1852.1-
22Morris County 14 1% -1852.0-
23Logan County 12 1% -1152.0-
24Trego County 11 1% -1351.9-
25Russell County 9   -1251.9-
26Wallace County 4   3351.7-
27Rawlins County -2   3651.6-
27Ottawa County -2   -751.6-
29Cheyenne County -4   -451.5-
29Phillips County -4   -8751.5-
31Clay County -7   -1751.4-
31Sheridan County -7   -651.4-
33Smith County -11 - -3951.3-
34Decatur County -14 - -1951.2-
34Osborne County -14 - 951.2-
36Harvey County -16 - -14351.1-
37Republic County -17 - -351.1-
38Atchison County -20 - -12051.0-
39Hodgeman County -21 - 6251.0-
40Nemaha County -22 - -5451.0-
41Wichita County -24 - 1450.9-
42Coffey County -25 - -5550.9-
42Stafford County -25 - -2650.9-
44Kingman County -27 - 5750.8-
45Chautauqua County -29 - -1650.7-
46Jewell County -30 - 3650.7-
47Kearny County -31 - -6850.7-
48Hamilton County -32 - -10950.6-
48Ness County -32 - 3250.6-
48Scott County -32 - -7150.6-
51Harper County -33 - -4650.6-
52Edwards County -36 - -4650.5-
53Wabaunsee County -37 - -3350.5-
54Cowley County -38 - -13950.5-
54Woodson County -38 - 1450.5-
54Crawford County -38 - -14350.5-
57Lincoln County -41 - -2850.4-
57Jackson County -41 - -6250.4-
59Morton County -46 - -7050.2-
60Haskell County -48 - -10950.2-
61Norton County -49 - 2750.1-
62Chase County -51 - 1550.1-
62Barber County -51 - 5550.1-
64Kiowa County -53 - -2250.0-
カンザス州郡の平均 -54 - -8850.0-
65Graham County -55 - 3850.0-
66Lane County -59 - 1949.8-
67Thomas County -64 - -3649.7-
68Stanton County -66 - -3549.6-
69Doniphan County -79 - -2349.2-
70Neosho County -80 - -7249.2-
71Washington County -87 - 6849.0-
72Rice County -98 - -2548.7-
73Jefferson County -100 - -16048.6-
73Leavenworth County -100 - 16348.6-
73Elk County -100 - -6148.6-
76Bourbon County -107 - -26048.4-
77Wilson County -110 - -12648.3-
78Pawnee County -114 - 4348.2-
79Franklin County -115 - -20848.1-
80Brown County -119 - -648.0-
81Linn County -120 - -2348.0-
82Grant County -121 - -4948.0-
83Marion County -128 - -8347.8-
84Anderson County -131 - -3347.7-
85Greenwood County -133 - -5047.6-
86Meade County -142 - -7147.3-
87Osage County -152 - 5347.0-
88Sumner County -156 - -27946.9-
89Gray County -160 - 3046.8-
90Cherokee County -166 - -13846.6-
91Saline County -193 - -34745.8-
92Barton County -196 - -8545.7-
93Seward County -213 - -17245.2-
94Miami County -215 - -25845.1-
95Labette County -247 - -11244.2-
96Reno County -253 - -14444.0-
97Ford County -295 - -19242.7-
98Butler County -312 - -28142.2-
99Lyon County -354 - -19940.9-
100Douglas County -376 - 3040.3-
101Montgomery County -477 - -69637.2-
102Wyandotte County -561 - -1,65934.7-
103Finney County -603 - -53933.4-
104Shawnee County -772 - -23928.3-
105Sedgwick County -1,729 - -2,955-0.5-
Pickup
ランキングカテゴリ一覧
States

全米・国内からの移住(2011年7月~翌年6月末)ランキングマップ(郡別)

国内からの移住(2011年7月~翌年6月末)ランキング(郡別)の偏差値にしたがって色分けしたアメリカ合衆国の全郡マップです。アメリカ合衆国におけるすべての郡(州の下の地域区分)の平均と比べて、数値が高い地域はより赤く、数値が低い地域はより青く色分けしています。

アメリカ州のエリアをクリックしてください。その州内における郡のランキングページを表示します。

全米・国内からの移住(2011年7月~翌年6月末)ランキングマップ(郡別) アラバマ州 Alabama アラスカ州 Alaska アリゾナ州 Arizona アーカンソー州 Arkansas カリフォルニア州 California コロラド州 Colorado コネチカット州 Connecticut デラウェア州 Delaware フロリダ州 Florida ジョージア州 Georgia ハワイ州 Hawaii アイダホ州 Idaho イリノイ州 Illinois インディアナ州 Indiana アイオワ州 Iowa カンザス州 Kansas ケンタッキー州 Kentucky ルイジアナ州 Louisiana メイン州 Maine メリーランド州 Maryland マサチューセッツ州 Massachusetts ミシガン州 Michigan ミネソタ州 Minnesota ミシシッピ州 Mississippi ミズーリ州 Missouri モンタナ州 Montana ネブラスカ州 Nebraska ネバダ州 Nevada ニューハンプシャー州 New Hampshire ニュージャージー州 New Jersey ニューメキシコ州 New Mexico ニューヨーク州 New York ノースカロライナ州 North Carolina ノースダコタ州 North Dakota オハイオ州 Ohio オクラホマ州 Oklahoma オレゴン州 Oregon ペンシルベニア州 Pennsylvania ロードアイランド州 Rhode Island サウスカロライナ州 South Carolina サウスダコタ州 South Dakota テネシー州 Tennessee テキサス州 Texas ユタ州 Utah バーモント州 Vermont バージニア州 Virginia ワシントン州 Washington ウェストバージニア州 West Virginia ウィスコンシン州 Wisconsin ワイオミング州 Wyoming デラウェア州 Delaware メリーランド州 Maryland ニューハンプシャー州 New Hampshire ニュージャージー州 New Jersey マサチューセッツ州 Massachusetts コネチカット州 Connecticut ウェストバージニア州 West Virginia バーモント州 Vermont ロードアイランド州 Rhode Island
このページの冒頭に戻る