イリノイ州の国内からの移住ランキング
イリノイ州の102郡を対象とした国内からの移住(2011年7月~翌年6月末)についてのランキングです。アメリカ合衆国における「郡」(countyまたはcounty-equivalent)は、州(state)の下の行政区画です。

「国内からの移住」は、アメリカ合衆国内からその地域への移住者数を示します。プラスの場合は国内の他の地域からその地域への転入を、マイナスの場合はその地域から国内の他の地域への転出を表します。
イリノイ州のランキングの1位はJohnson Countyの151人、2位はKendall Countyの149人、3位はMcLean Countyの117人です。
イリノイ州のランキングの最下位(102位)はCook Countyの-31,553人です。
このランキングには、ランキングマップがあります。偏差値にしたがって地図上の地域を色分けすることで、ひと目で国内からの移住(2011年7月~翌年6月末)の状況が分かるようになっています。
全米・国内からの移住(2011年7月~翌年6月末)ランキング(州別)や全米・国内からの移住(2011年7月~翌年6月末)ランキング(郡別)もあります。全米の郡別ランキングはサイズの大きなページとなるため、お使いのインターネット環境によっては、読み込みに時間がかかる場合があります。
イリノイ州のページではイリノイ州についてのすべてのランキング順位を確認できます。
| 順位 | 郡 | 国内からの移住(2011年7月~翌年6月末) |
国内からの移住(2010年7月~翌年6月末) |
偏差値 | 評価 |
|---|
| 1 | Johnson County |
151人 |
  |
40人 | 52.7 | - |
| 2 | Kendall County |
149人 |
|
162人 | 52.7 | - |
| 3 | McLean County |
117人 |
|
-611人 | 52.6 | - |
| 4 | Stark County |
114人 |
|
-106人 | 52.6 | - |
| 5 | Tazewell County |
113人 |
|
67人 | 52.6 | - |
| 6 | Clark County |
90人 |
|
-53人 | 52.5 | - |
| 7 | Ford County |
84人 |
|
-63人 | 52.5 | - |
| 8 | Washington County |
52人 |
|
-122人 | 52.4 | - |
| 9 | Scott County |
51人 |
|
-108人 | 52.4 | - |
| 10 | Saline County |
41人 |
|
69人 | 52.4 | - |
| 11 | Brown County |
39人 |
|
-22人 | 52.4 | - |
| 12 | White County |
35人 |
|
48人 | 52.4 | - |
| 13 | Moultrie County |
30人 |
|
55人 | 52.3 | - |
| 14 | Monroe County |
28人 |
|
181人 | 52.3 | - |
| 15 | Adams County |
27人 |
|
-33人 | 52.3 | - |
| 16 | Menard County |
22人 |
|
19人 | 52.3 | - |
| 17 | Edwards County |
21人 |
|
-58人 | 52.3 | - |
| 18 | McDonough County |
20人 |
|
-98人 | 52.3 | - |
| 19 | Williamson County |
14人 |
|
233人 | 52.3 | - |
| 20 | Clay County |
11人 |
|
-37人 | 52.3 | - |
| 21 | Hardin County |
3人 |
|
0人 | 52.3 | - |
| 22 | Wayne County |
0人 |
|
-118人 | 52.2 | - |
| 23 | Schuyler County |
-4人 |
- |
-55人 | 52.2 | - |
| 24 | Hamilton County |
-16人 |
- |
-9人 | 52.2 | - |
| 25 | Union County |
-34人 |
- |
-41人 | 52.1 | - |
| 26 | De Witt County |
-35人 |
- |
-26人 | 52.1 | - |
| 27 | Pulaski County |
-40人 |
- |
-124人 | 52.1 | - |
| 28 | Calhoun County |
-43人 |
- |
-32人 | 52.1 | - |
| 29 | Richland County |
-52人 |
- |
-6人 | 52.1 | - |
| 30 | Gallatin County |
-58人 |
- |
-35人 | 52.1 | - |
| 31 | Shelby County |
-59人 |
- |
-56人 | 52.1 | - |
| 32 | Effingham County |
-61人 |
- |
-49人 | 52.1 | - |
| 33 | Douglas County |
-62人 |
- |
-221人 | 52.1 | - |
| 34 | Lawrence County |
-65人 |
- |
-63人 | 52.0 | - |
| 35 | Putnam County |
-66人 |
- |
-19人 | 52.0 | - |
| 36 | Montgomery County |
-69人 |
- |
-185人 | 52.0 | - |
| 37 | Pike County |
-79人 |
- |
-1人 | 52.0 | - |
| 38 | Mason County |
-80人 |
- |
-110人 | 52.0 | - |
| 39 | Franklin County |
-91人 |
- |
74人 | 52.0 | - |
| 40 | Henry County |
-102人 |
- |
-130人 | 51.9 | - |
| 41 | Jefferson County |
-106人 |
- |
-42人 | 51.9 | - |
| 42 | Woodford County |
-108人 |
- |
126人 | 51.9 | - |
| 42 | Jasper County |
-108人 |
- |
20人 | 51.9 | - |
| 44 | Carroll County |
-109人 |
- |
-112人 | 51.9 | - |
| 45 | Warren County |
-110人 |
- |
108人 | 51.9 | - |
| 46 | Bond County |
-113人 |
- |
-64人 | 51.9 | - |
| 47 | Jo Daviess County |
-119人 |
- |
72人 | 51.9 | - |
| 47 | Wabash County |
-119人 |
- |
-92人 | 51.9 | - |
| 49 | Grundy County |
-120人 |
- |
-313人 | 51.9 | - |
| 50 | Cumberland County |
-126人 |
- |
26人 | 51.9 | - |
| 51 | Mercer County |
-129人 |
- |
-49人 | 51.8 | - |
| 52 | Massac County |
-131人 |
- |
-65人 | 51.8 | - |
| 53 | Henderson County |
-132人 |
- |
-92人 | 51.8 | - |
| 54 | Jersey County |
-133人 |
- |
-97人 | 51.8 | - |
| 55 | Crawford County |
-139人 |
- |
8人 | 51.8 | - |
| 56 | Hancock County |
-144人 |
- |
-50人 | 51.8 | - |
| 57 | Clinton County |
-149人 |
- |
172人 | 51.8 | - |
| 58 | Marion County |
-154人 |
- |
-521人 | 51.8 | - |
| 59 | Marshall County |
-156人 |
- |
-90人 | 51.8 | - |
| 60 | Perry County |
-161人 |
- |
-58人 | 51.7 | - |
| 61 | Coles County |
-165人 |
- |
-185人 | 51.7 | - |
| 61 | Pope County |
-165人 |
- |
-2人 | 51.7 | - |
| 63 | Piatt County |
-172人 |
- |
-38人 | 51.7 | - |
| 64 | Fulton County |
-174人 |
- |
-14人 | 51.7 | - |
| 65 | Fayette County |
-195人 |
- |
-4人 | 51.6 | - |
| 66 | Edgar County |
-197人 |
- |
-49人 | 51.6 | - |
| 67 | Iroquois County |
-198人 |
- |
-103人 | 51.6 | - |
| 68 | Christian County |
-203人 |
- |
10人 | 51.6 | - |
| 69 | Greene County |
-208人 |
- |
-31人 | 51.6 | - |
| 70 | Logan County |
-238人 |
- |
-42人 | 51.5 | - |
| 71 | Sangamon County |
-256人 |
- |
467人 | 51.4 | - |
| 72 | Randolph County |
-267人 |
- |
-140人 | 51.4 | - |
| 73 | Morgan County |
-271人 |
- |
22人 | 51.4 | - |
| 74 | Alexander County |
-277人 |
- |
-222人 | 51.4 | - |
| 75 | Cass County |
-288人 |
- |
-70人 | 51.3 | - |
| 76 | Bureau County |
-309人 |
- |
-243人 | 51.3 | - |
| 77 | Livingston County |
-355人 |
- |
-74人 | 51.1 | - |
| 78 | Knox County |
-368人 |
- |
-118人 | 51.1 | - |
| 79 | Ogle County |
-376人 |
- |
-370人 | 51.1 | - |
| 80 | Lee County |
-394人 |
- |
-468人 | 51.0 | - |
| 81 | Whiteside County |
-430人 |
- |
-262人 | 50.9 | - |
| 82 | Stephenson County |
-432人 |
- |
-250人 | 50.9 | - |
| 83 | Macoupin County |
-502人 |
- |
54人 | 50.7 | - |
| 84 | DeKalb County |
-518人 |
- |
-1,352人 | 50.6 | - |
| 85 | LaSalle County |
-548人 |
- |
-382人 | 50.5 | - |
| 86 | Boone County |
-609人 |
- |
-191人 | 50.3 | - |
| 87 | Rock Island County |
-612人 |
- |
-863人 | 50.3 | - |
| 88 | Jackson County |
-624人 |
- |
-520人 | 50.3 | - |
| 89 | Peoria County |
-714人 |
- |
-623人 | 50.0 | - |
| イリノイ州郡の平均 |
-720人 |
- |
-683人 | 50.0 | - |
| 90 | Macon County |
-791人 |
- |
-413人 | 49.8 | - |
| 91 | Vermilion County |
-795人 |
- |
-364人 | 49.8 | - |
| 92 | Kankakee County |
-916人 |
- |
-360人 | 49.4 | - |
| 93 | Madison County |
-1,249人 |
- |
-1,442人 | 48.3 | - |
| 94 | Champaign County |
-1,632人 |
- |
-1,519人 | 47.2 | - |
| 95 | McHenry County |
-1,979人 |
- |
-3,209人 | 46.1 | - |
| 96 | Kane County |
-2,716人 |
- |
-1,262人 | 43.8 | - |
| 97 | St. Clair County |
-2,857人 |
- |
-1,415人 | 43.3 | - |
| 98 | Winnebago County |
-2,966人 |
- |
-2,760人 | 43.0 | - |
| 99 | Will County |
-3,397人 |
- |
-3,661人 | 41.6 | - |
| 100 | DuPage County |
-4,007人 |
- |
-1,361人 | 39.7 | - |
| 101 | Lake County |
-6,160人 |
- |
-8,365人 | 33.0 | - |
| 102 | Cook County |
-31,553人 |
- |
-34,684人 | -46.2 | - |
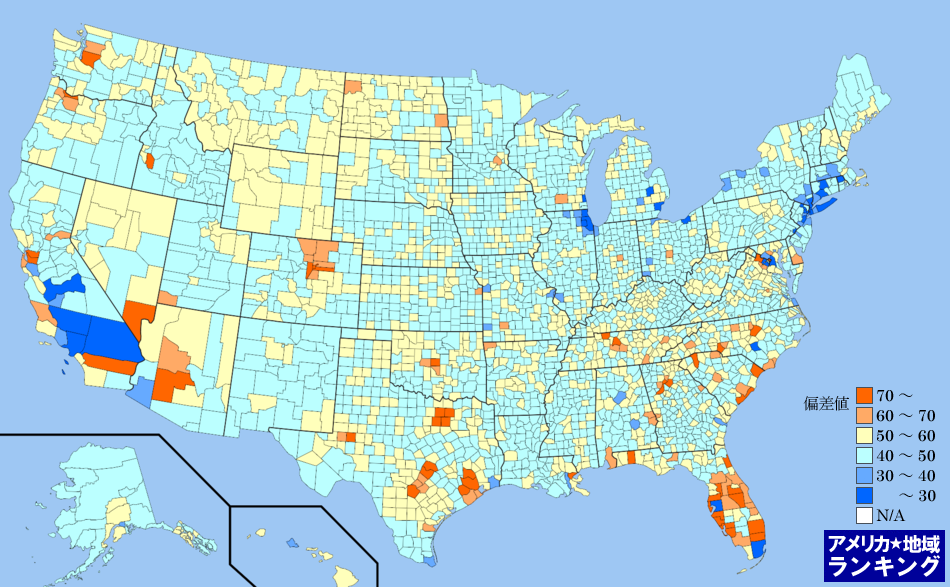
全米・国内からの移住(2011年7月~翌年6月末)ランキングマップ(郡別)
国内からの移住(2011年7月~翌年6月末)ランキング(郡別)の偏差値にしたがって色分けしたアメリカ合衆国の全郡マップです。アメリカ合衆国におけるすべての郡(州の下の地域区分)の平均と比べて、数値が高い地域はより赤く、数値が低い地域はより青く色分けしています。
アメリカ州のエリアをクリックしてください。その州内における郡のランキングページを表示します。