ネブラスカ州の国内からの移住ランキング
ネブラスカ州の93郡を対象とした国内からの移住(2010年7月~翌年6月末)についてのランキングです。アメリカ合衆国における「郡」(countyまたはcounty-equivalent)は、州(state)の下の行政区画です。
「国内からの移住」は、アメリカ合衆国内からその地域への移住者数を示します。プラスの場合は国内の他の地域からその地域への転入を、マイナスの場合はその地域から国内の他の地域への転出を表します。
ネブラスカ州のランキングの1位はSarpy Countyの887人、2位はLancaster Countyの802人、3位はDouglas Countyの447人です。
ネブラスカ州のランキングの最下位(93位)はDakota Countyの-460人です。
このランキングには、ランキングマップがあります。偏差値にしたがって地図上の地域を色分けすることで、ひと目で国内からの移住(2010年7月~翌年6月末)の状況が分かるようになっています。
全米・国内からの移住(2010年7月~翌年6月末)ランキング(州別)や全米・国内からの移住(2010年7月~翌年6月末)ランキング(郡別)もあります。全米の郡別ランキングはサイズの大きなページとなるため、お使いのインターネット環境によっては、読み込みに時間がかかる場合があります。
ネブラスカ州のページではネブラスカ州についてのすべてのランキング順位を確認できます。
| 順位 | 郡 | 国内からの移住(2010年7月~翌年6月末) |
人口(推計) |
偏差値 | 評価 |
|---|
| 1 | Sarpy County |
887人 |
  |
159,703人 | 105.6 | - |
| 2 | Lancaster County |
802人 |
|
286,161人 | 100.4 | - |
| 3 | Douglas County |
447人 |
|
518,665人 | 78.6 | - |
| 4 | Buffalo County |
194人 |
|
46,154人 | 63.1 | - |
| 5 | Hall County |
80人 |
|
58,771人 | 56.1 | - |
| 6 | Kearney County |
56人 |
|
6,491人 | 54.6 | - |
| 7 | Jefferson County |
48人 |
|
7,513人 | 54.1 | - |
| 8 | Howard County |
43人 |
|
6,261人 | 53.8 | - |
| 9 | Deuel County |
42人 |
|
1,941人 | 53.8 | - |
| 10 | Chase County |
32人 |
|
3,963人 | 53.2 | - |
| 11 | Thomas County |
31人 |
|
649人 | 53.1 | - |
| 12 | Saline County |
25人 |
|
14,219人 | 52.7 | - |
| 13 | Dixon County |
22人 |
|
5,966人 | 52.6 | - |
| 14 | Nemaha County |
21人 |
|
7,250人 | 52.5 | - |
| 15 | Pawnee County |
20人 |
|
2,765人 | 52.4 | - |
| 16 | Grant County |
19人 |
|
612人 | 52.4 | - |
| 16 | Cherry County |
19人 |
|
5,712人 | 52.4 | - |
| 18 | Harlan County |
18人 |
|
3,416人 | 52.3 | - |
| 18 | Richardson County |
18人 |
|
8,348人 | 52.3 | - |
| 20 | Furnas County |
16人 |
|
4,953人 | 52.2 | - |
| 21 | Nance County |
14人 |
|
3,723人 | 52.1 | - |
| 22 | Sioux County |
11人 |
|
1,312人 | 51.9 | - |
| 23 | Hooker County |
10人 |
|
735人 | 51.8 | - |
| 24 | McPherson County |
8人 |
|
538人 | 51.7 | - |
| 24 | Stanton County |
8人 |
|
6,121人 | 51.7 | - |
| 24 | Dawes County |
8人 |
|
9,167人 | 51.7 | - |
| 27 | Banner County |
7人 |
|
697人 | 51.6 | - |
| 27 | Blaine County |
7人 |
|
473人 | 51.6 | - |
| 29 | Hayes County |
6人 |
|
960人 | 51.6 | - |
| 30 | Logan County |
2人 |
|
770人 | 51.3 | - |
| 31 | Arthur County |
0人 |
|
465人 | 51.2 | - |
| 31 | York County |
0人 |
|
13,644人 | 51.2 | - |
| 33 | Otoe County |
-2人 |
|
15,772人 | 51.1 | - |
| 33 | Keya Paha County |
-2人 |
|
822人 | 51.1 | - |
| 35 | Custer County |
-3人 |
|
10,911人 | 51.0 | - |
| 36 | Sherman County |
-6人 |
- |
3,145人 | 50.8 | - |
| 37 | Fillmore County |
-7人 |
- |
5,880人 | 50.8 | - |
| 38 | Franklin County |
-10人 |
- |
3,228人 | 50.6 | - |
| 38 | Wheeler County |
-10人 |
- |
822人 | 50.6 | - |
| 40 | Greeley County |
-12人 |
- |
2,541人 | 50.5 | - |
| 41 | Holt County |
-15人 |
- |
10,442人 | 50.3 | - |
| 41 | Loup County |
-15人 |
- |
627人 | 50.3 | - |
| 43 | Valley County |
-16人 |
- |
4,262人 | 50.2 | - |
| 43 | Thayer County |
-16人 |
- |
5,214人 | 50.2 | - |
| 43 | Boyd County |
-16人 |
- |
2,099人 | 50.2 | - |
| 46 | Burt County |
-17人 |
- |
6,842人 | 50.2 | - |
| 47 | Box Butte County |
-18人 |
- |
11,276人 | 50.1 | - |
| ネブラスカ州郡の平均 |
-20人 |
- |
19,674人 | 50.0 | - |
| 48 | Nuckolls County |
-20人 |
- |
4,501人 | 50.0 | - |
| 49 | Washington County |
-23人 |
- |
20,268人 | 49.8 | - |
| 49 | Dundy County |
-23人 |
- |
2,008人 | 49.8 | - |
| 49 | Hitchcock County |
-23人 |
- |
2,896人 | 49.8 | - |
| 52 | Cuming County |
-26人 |
- |
9,139人 | 49.6 | - |
| 53 | Johnson County |
-27人 |
- |
5,214人 | 49.5 | - |
| 54 | Phelps County |
-28人 |
- |
9,186人 | 49.5 | - |
| 55 | Polk County |
-30人 |
- |
5,380人 | 49.4 | - |
| 56 | Frontier County |
-34人 |
- |
2,752人 | 49.1 | - |
| 57 | Antelope County |
-35人 |
- |
6,654人 | 49.1 | - |
| 58 | Webster County |
-40人 |
- |
3,819人 | 48.7 | - |
| 58 | Kimball County |
-40人 |
- |
3,822人 | 48.7 | - |
| 58 | Perkins County |
-40人 |
- |
2,980人 | 48.7 | - |
| 61 | Garden County |
-46人 |
- |
2,079人 | 48.4 | - |
| 62 | Cedar County |
-48人 |
- |
8,821人 | 48.3 | - |
| 63 | Red Willow County |
-50人 |
- |
11,046人 | 48.1 | - |
| 64 | Garfield County |
-52人 |
- |
2,041人 | 48.0 | - |
| 65 | Dodge County |
-53人 |
- |
36,663人 | 48.0 | - |
| 66 | Brown County |
-58人 |
- |
3,145人 | 47.6 | - |
| 67 | Clay County |
-59人 |
- |
6,543人 | 47.6 | - |
| 68 | Sheridan County |
-61人 |
- |
5,458人 | 47.5 | - |
| 69 | Cheyenne County |
-62人 |
- |
9,969人 | 47.4 | - |
| 70 | Hamilton County |
-66人 |
- |
9,122人 | 47.2 | - |
| 71 | Knox County |
-73人 |
- |
8,674人 | 46.7 | - |
| 72 | Platte County |
-74人 |
- |
32,269人 | 46.7 | - |
| 73 | Saunders County |
-80人 |
- |
20,841人 | 46.3 | - |
| 74 | Pierce County |
-81人 |
- |
7,256人 | 46.2 | - |
| 75 | Cass County |
-87人 |
- |
25,258人 | 45.9 | - |
| 76 | Butler County |
-88人 |
- |
8,376人 | 45.8 | - |
| 77 | Boone County |
-96人 |
- |
5,496人 | 45.3 | - |
| 78 | Rock County |
-101人 |
- |
1,507人 | 45.0 | - |
| 78 | Colfax County |
-101人 |
- |
10,535人 | 45.0 | - |
| 80 | Seward County |
-111人 |
- |
16,796人 | 44.4 | - |
| 81 | Gosper County |
-114人 |
- |
2,047人 | 44.2 | - |
| 82 | Keith County |
-123人 |
- |
8,366人 | 43.7 | - |
| 83 | Thurston County |
-128人 |
- |
6,972人 | 43.4 | - |
| 84 | Merrick County |
-131人 |
- |
7,847人 | 43.2 | - |
| 85 | Morrill County |
-140人 |
- |
5,039人 | 42.6 | - |
| 86 | Wayne County |
-146人 |
- |
9,607人 | 42.3 | - |
| 87 | Madison County |
-195人 |
- |
34,921人 | 39.2 | - |
| 88 | Dawson County |
-244人 |
- |
24,355人 | 36.2 | - |
| 89 | Adams County |
-251人 |
- |
31,352人 | 35.8 | - |
| 90 | Scotts Bluff County |
-265人 |
- |
37,068人 | 35.0 | - |
| 91 | Gage County |
-270人 |
- |
22,301人 | 34.6 | - |
| 92 | Lincoln County |
-276人 |
- |
36,268人 | 34.3 | - |
| 93 | Dakota County |
-460人 |
- |
21,038人 | 23.0 | - |
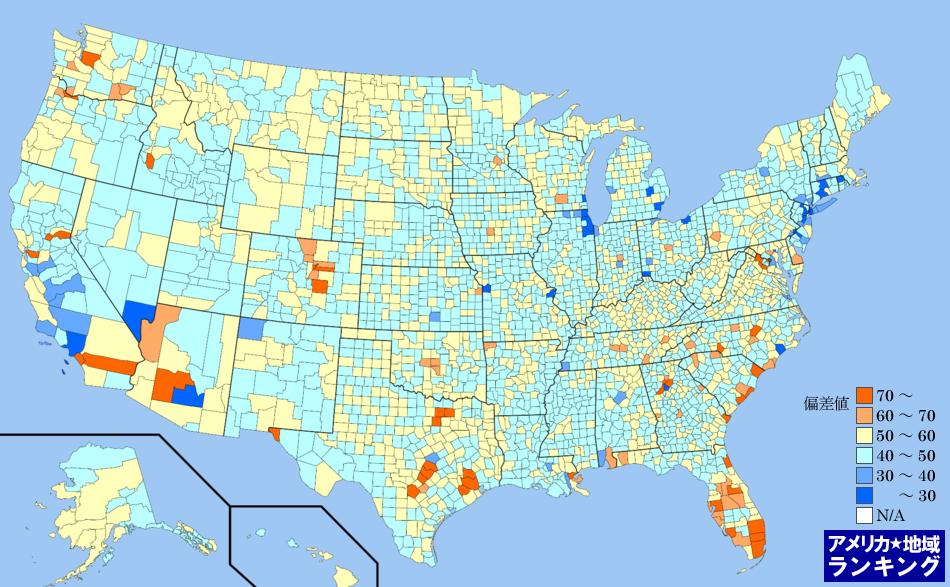
全米・国内からの移住(2010年7月~翌年6月末)ランキングマップ(郡別)
国内からの移住(2010年7月~翌年6月末)ランキング(郡別)の偏差値にしたがって色分けしたアメリカ合衆国の全郡マップです。アメリカ合衆国におけるすべての郡(州の下の地域区分)の平均と比べて、数値が高い地域はより赤く、数値が低い地域はより青く色分けしています。
アメリカ州のエリアをクリックしてください。その州内における郡のランキングページを表示します。