ミシガン州の国内からの移住ランキング
ミシガン州の83郡を対象とした国内からの移住(2010年7月~翌年6月末)についてのランキングです。アメリカ合衆国における「郡」(countyまたはcounty-equivalent)は、州(state)の下の行政区画です。

「国内からの移住」は、アメリカ合衆国内からその地域への移住者数を示します。プラスの場合は国内の他の地域からその地域への転入を、マイナスの場合はその地域から国内の他の地域への転出を表します。
ミシガン州のランキングの1位はGrand Traverse Countyの1,074人、2位はOakland Countyの919人、3位はLivingston Countyの696人です。
ミシガン州のランキングの最下位(83位)はWayne Countyの-23,794人です。
このランキングには、ランキングマップがあります。偏差値にしたがって地図上の地域を色分けすることで、ひと目で国内からの移住(2010年7月~翌年6月末)の状況が分かるようになっています。
全米・国内からの移住(2010年7月~翌年6月末)ランキング(州別)や全米・国内からの移住(2010年7月~翌年6月末)ランキング(郡別)もあります。全米の郡別ランキングはサイズの大きなページとなるため、お使いのインターネット環境によっては、読み込みに時間がかかる場合があります。
ミシガン州のページではミシガン州についてのすべてのランキング順位を確認できます。
| 順位 | 郡 | 国内からの移住(2010年7月~翌年6月末) |
人口(推計) |
偏差値 | 評価 |
|---|
| 1 | Grand Traverse County |
1,074人 |
  |
87,034人 | 56.0 | - |
| 2 | Oakland County |
919人 |
|
1,203,036人 | 55.4 | - |
| 3 | Livingston County |
696人 |
|
180,999人 | 54.5 | - |
| 4 | Mecosta County |
390人 |
|
42,815人 | 53.4 | - |
| 5 | Marquette County |
362人 |
|
67,116人 | 53.3 | - |
| 6 | Ottawa County |
290人 |
|
264,117人 | 53.0 | - |
| 7 | Kalamazoo County |
280人 |
|
250,729人 | 53.0 | - |
| 8 | Manistee County |
279人 |
|
24,566人 | 53.0 | - |
| 9 | Chippewa County |
225人 |
|
38,482人 | 52.8 | - |
| 10 | Gladwin County |
223人 |
|
25,702人 | 52.8 | - |
| 11 | Cass County |
152人 |
|
52,197人 | 52.5 | - |
| 12 | Midland County |
145人 |
|
83,637人 | 52.5 | - |
| 13 | Charlevoix County |
129人 |
|
25,909人 | 52.4 | - |
| 14 | Missaukee County |
96人 |
|
14,822人 | 52.3 | - |
| 15 | Oscoda County |
87人 |
|
8,614人 | 52.2 | - |
| 16 | Emmet County |
84人 |
|
32,663人 | 52.2 | - |
| 17 | Iron County |
68人 |
|
11,799人 | 52.2 | - |
| 18 | Dickinson County |
58人 |
|
26,137人 | 52.1 | - |
| 19 | Clinton County |
55人 |
|
75,400人 | 52.1 | - |
| 20 | Keweenaw County |
50人 |
|
2,142人 | 52.1 | - |
| 20 | Kent County |
50人 |
|
602,982人 | 52.1 | - |
| 22 | Alger County |
43人 |
|
9,554人 | 52.1 | - |
| 23 | Schoolcraft County |
42人 |
|
8,484人 | 52.1 | - |
| 23 | Roscommon County |
42人 |
|
24,463人 | 52.1 | - |
| 25 | Kalkaska County |
38人 |
|
17,133人 | 52.1 | - |
| 26 | Mackinac County |
27人 |
|
11,091人 | 52.0 | - |
| 26 | Lake County |
27人 |
|
11,510人 | 52.0 | - |
| 28 | Baraga County |
24人 |
|
8,838人 | 52.0 | - |
| 29 | Clare County |
22人 |
|
30,993人 | 52.0 | - |
| 30 | Alcona County |
10人 |
|
10,899人 | 52.0 | - |
| 31 | Ogemaw County |
6人 |
|
21,647人 | 51.9 | - |
| 32 | Isabella County |
2人 |
|
70,321人 | 51.9 | - |
| 33 | Cheboygan County |
-2人 |
|
26,096人 | 51.9 | - |
| 34 | Menominee County |
-4人 |
|
23,984人 | 51.9 | - |
| 35 | Crawford County |
-10人 |
- |
14,040人 | 51.9 | - |
| 36 | Presque Isle County |
-21人 |
- |
13,307人 | 51.8 | - |
| 37 | Benzie County |
-26人 |
- |
17,517人 | 51.8 | - |
| 38 | Luce County |
-47人 |
- |
6,598人 | 51.7 | - |
| 39 | Mason County |
-49人 |
- |
28,715人 | 51.7 | - |
| 40 | Otsego County |
-50人 |
- |
24,161人 | 51.7 | - |
| 41 | Washtenaw County |
-53人 |
- |
345,350人 | 51.7 | - |
| 42 | Ontonagon County |
-65人 |
- |
6,746人 | 51.7 | - |
| 43 | Delta County |
-74人 |
- |
37,068人 | 51.6 | - |
| 44 | Montmorency County |
-76人 |
- |
9,765人 | 51.6 | - |
| 45 | Antrim County |
-84人 |
- |
23,511人 | 51.6 | - |
| 46 | Newaygo County |
-87人 |
- |
48,394人 | 51.6 | - |
| 47 | Leelanau County |
-102人 |
- |
21,677人 | 51.5 | - |
| 48 | Hillsdale County |
-103人 |
- |
46,603人 | 51.5 | - |
| 49 | Iosco County |
-114人 |
- |
25,806人 | 51.5 | - |
| 50 | Osceola County |
-131人 |
- |
23,515人 | 51.4 | - |
| 51 | Alpena County |
-144人 |
- |
29,551人 | 51.4 | - |
| 52 | Houghton County |
-152人 |
- |
36,694人 | 51.3 | - |
| 53 | Wexford County |
-156人 |
- |
32,766人 | 51.3 | - |
| 54 | Gogebic County |
-169人 |
- |
16,386人 | 51.3 | - |
| 55 | Arenac County |
-178人 |
- |
15,873人 | 51.3 | - |
| 56 | Lapeer County |
-183人 |
- |
88,187人 | 51.2 | - |
| 57 | Oceana County |
-204人 |
- |
26,527人 | 51.2 | - |
| 58 | Ionia County |
-227人 |
- |
63,883人 | 51.1 | - |
| 59 | Huron County |
-237人 |
- |
33,063人 | 51.0 | - |
| 60 | Tuscola County |
-248人 |
- |
55,665人 | 51.0 | - |
| 61 | Montcalm County |
-264人 |
- |
63,320人 | 50.9 | - |
| 62 | Eaton County |
-270人 |
- |
107,878人 | 50.9 | - |
| 63 | Barry County |
-309人 |
- |
59,062人 | 50.8 | - |
| 64 | Sanilac County |
-362人 |
- |
43,044人 | 50.6 | - |
| 65 | Gratiot County |
-371人 |
- |
42,439人 | 50.5 | - |
| 66 | Van Buren County |
-440人 |
- |
76,182人 | 50.3 | - |
| 67 | Lenawee County |
-446人 |
- |
99,646人 | 50.2 | - |
| 68 | St. Joseph County |
-476人 |
- |
61,259人 | 50.1 | - |
| ミシガン州郡の平均 |
-511人 |
- |
119,008人 | 50.0 | - |
| 69 | Bay County |
-540人 |
- |
107,723人 | 49.9 | - |
| 70 | Allegan County |
-641人 |
- |
111,472人 | 49.5 | - |
| 71 | Shiawassee County |
-671人 |
- |
70,610人 | 49.4 | - |
| 72 | Monroe County |
-769人 |
- |
151,960人 | 49.0 | - |
| 73 | Jackson County |
-817人 |
- |
160,226人 | 48.9 | - |
| 74 | Berrien County |
-855人 |
- |
156,799人 | 48.7 | - |
| 75 | Macomb County |
-972人 |
- |
841,291人 | 48.3 | - |
| 76 | Calhoun County |
-990人 |
- |
136,075人 | 48.2 | - |
| 77 | St. Clair County |
-1,216人 |
- |
162,717人 | 47.4 | - |
| 78 | Saginaw County |
-1,334人 |
- |
199,940人 | 46.9 | - |
| 79 | Branch County |
-1,473人 |
- |
45,147人 | 46.4 | - |
| 80 | Ingham County |
-1,568人 |
- |
280,882人 | 46.0 | - |
| 81 | Muskegon County |
-2,502人 |
- |
171,969人 | 42.5 | - |
| 82 | Genesee County |
-4,342人 |
- |
425,152人 | 35.6 | - |
| 83 | Wayne County |
-23,794人 |
- |
1,815,598人 | -37.5 | - |
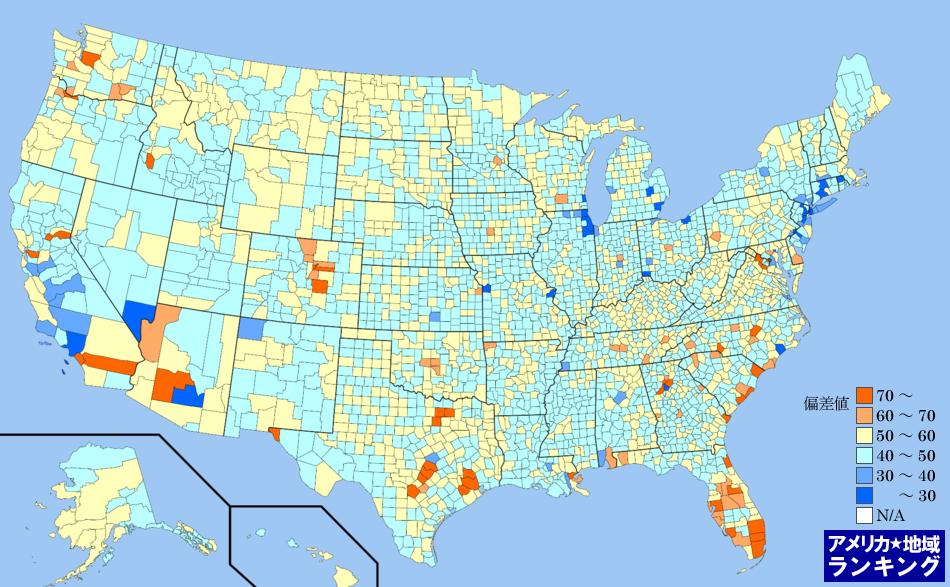
全米・国内からの移住(2010年7月~翌年6月末)ランキングマップ(郡別)
国内からの移住(2010年7月~翌年6月末)ランキング(郡別)の偏差値にしたがって色分けしたアメリカ合衆国の全郡マップです。アメリカ合衆国におけるすべての郡(州の下の地域区分)の平均と比べて、数値が高い地域はより赤く、数値が低い地域はより青く色分けしています。
アメリカ州のエリアをクリックしてください。その州内における郡のランキングページを表示します。