アメリカ地域ランキング - State and County Rankings in America

ホーム > 死亡数 > ケンタッキー州(郡別)

ケンタッキー州の死亡数ランキング

カテゴリ人口の変化 > 死亡

ケンタッキー州の120郡を対象とした死亡数(2011年7月~翌年6月末)についてのランキングです。アメリカ合衆国における「郡」(countyまたはcounty-equivalent)は、州(state)の下の行政区画です。

ケンタッキー州の州旗

ケンタッキー州のランキングの1位はJefferson Countyの6,995人、2位はFayette Countyの2,008人、3位はKenton Countyの1,333人です。

ケンタッキー州のランキングの最下位(120位)はRobertson Countyの31人です。

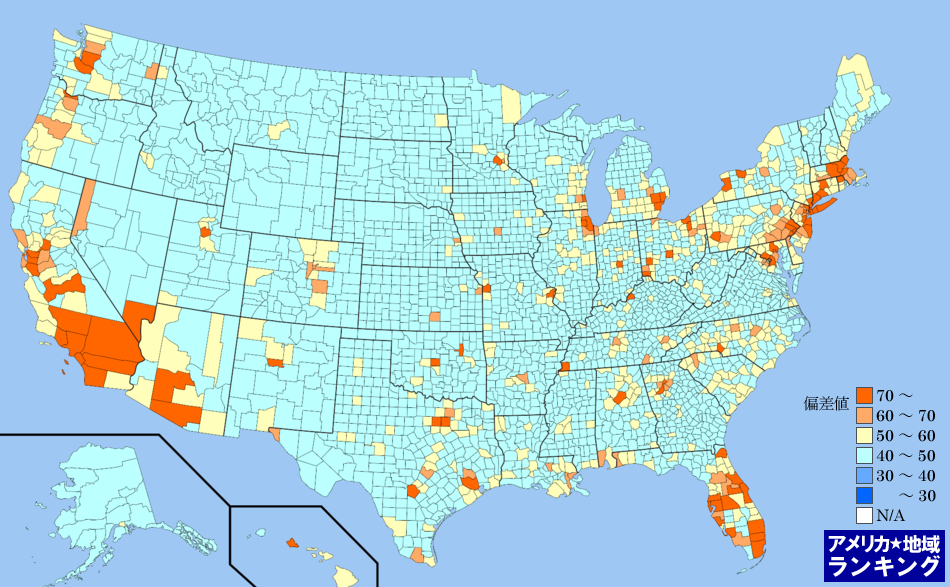
このランキングには、ランキングマップがあります。偏差値にしたがって地図上の地域を色分けすることで、ひと目で死亡数(2011年7月~翌年6月末)の状況が分かるようになっています。

全米・死亡数(2011年7月~翌年6月末)ランキング(州別)全米・死亡数(2011年7月~翌年6月末)ランキング(郡別)もあります。全米の郡別ランキングはサイズの大きなページとなるため、お使いのインターネット環境によっては、読み込みに時間がかかる場合があります。

ケンタッキー州のページではケンタッキー州についてのすべてのランキング順位を確認できます。

順位死亡数(2011年7月~翌年6月末) 死亡数(2010年7月~翌年6月末) 偏差値評価
【情報源と計算式】死亡数(2011年7月~翌年6月末):米国勢調査局 2012年 死亡数(2010年7月~翌年6月末):米国勢調査局 2011年
1Jefferson County 6,995 100%100% 7,055149.6-
2Fayette County 2,008 29%29% 2,04674.8-
3Kenton County 1,333 19%19% 1,32264.7-
4Daviess County 962 14%14% 96759.1-
5Hardin County 874 12%12% 83857.8-
6Warren County 860 12%12% 84957.6-
7Campbell County 845 12%12% 80857.3-
8McCracken County 824 12%12% 81257.0-
9Boone County 793 11%11% 76556.6-
10Pike County 792 11%11% 82456.5-
11Pulaski County 750 11%11% 74455.9-
12Madison County 636 9%9% 65854.2-
13Christian County 603 9%9% 59253.7-
14Boyd County 586 8%8% 61153.5-
15Laurel County 577 8%8% 57353.3-
16Floyd County 535 8%8% 51952.7-
17Hopkins County 525 8%8% 52152.5-
18Bullitt County 520 7%7% 48752.5-
19Henderson County 499 7%7% 51752.1-
20Barren County 484 7%7% 46651.9-
21Franklin County 461 7%7% 48351.6-
22Whitley County 455 7%7% 45851.5-
23Greenup County 453 6%6% 46051.5-
24Perry County 432 6%6% 43851.1-
25Marshall County 430 6%6% 41951.1-
26Graves County 414 6%6% 43550.9-
27Muhlenberg County 407 6%6% 39050.8-
27Knox County 407 6%6% 39750.8-
29Calloway County 398 6%6% 39950.6-
30Harlan County 388 6%6% 39250.5-
31Bell County 368 5%5% 37950.2-
32Nelson County 365 5%5% 37650.1-
ケンタッキー州郡の平均 356 - 35650.0-
33Jessamine County 354 5%5% 36150.0-
34Clark County 349 5%5% 36249.9-
35Scott County 336 5%5% 31049.7-
36Carter County 334 5%5% 32749.7-
37Oldham County 323 5%5% 32849.5-
38Taylor County 304 4% 28349.2-
39Letcher County 286 4% 29749.0-
40Boyle County 283 4% 29148.9-
41Johnson County 282 4% 27248.9-
42Grayson County 281 4% 28948.9-
43Logan County 278 4% 30248.8-
44Shelby County 276 4% 31548.8-
45Montgomery County 268 4% 25748.7-
46Lincoln County 266 4% 27748.7-
47Mercer County 258 4% 24848.5-
48Ohio County 257 4% 26048.5-
49Clay County 246 4% 26548.4-
50Allen County 241 3% 23148.3-
51Rockcastle County 240 3% 21648.3-
52Grant County 222 3% 21248.0-
53Bourbon County 220 3% 21848.0-
53Adair County 220 3% 19648.0-
55Lawrence County 217 3% 21947.9-
56Russell County 216 3% 23747.9-
57Harrison County 208 3% 21447.8-
58Woodford County 204 3% 21447.7-
59Wayne County 203 3% 19547.7-
59Meade County 203 3% 21747.7-
61Breckinridge County 200 3% 20147.7-
62Mason County 198 3% 18647.6-
62Rowan County 198 3% 22047.6-
64Casey County 194 3% 20447.6-
65Breathitt County 189 3% 19447.5-
65Marion County 189 3% 18747.5-
65Hart County 189 3% 17447.5-
68Anderson County 185 3% 18447.4-
69Knott County 183 3% 19747.4-
70Union County 177 3% 18647.3-
71Estill County 175 3% 18247.3-
72Fleming County 174 2% 17647.3-
73Leslie County 171 2% 16747.2-
73McCreary County 171 2% 17747.2-
75Caldwell County 169 2% 17347.2-
75Garrard County 169 2% 15847.2-
77Larue County 166 2% 17247.2-
77Henry County 166 2% 16847.2-
77Morgan County 166 2% 15547.2-
77Trigg County 166 2% 17147.2-
81Webster County 161 2% 17147.1-
81Monroe County 161 2% 16247.1-
83Pendleton County 158 2% 15547.0-
84Bath County 157 2% 15247.0-
84Simpson County 157 2% 17347.0-
86Magoffin County 153 2% 14447.0-
87Jackson County 151 2% 16846.9-
87Martin County 151 2% 15046.9-
89Lewis County 149 2% 15546.9-
90Spencer County 141 2% 13746.8-
90Powell County 141 2% 15646.8-
92Edmonson County 140 2% 14046.8-
93Metcalfe County 139 2% 13746.7-
94Todd County 136 2% 13546.7-
94Washington County 136 2% 12446.7-
96Green County 135 2% 12946.7-
97Lyon County 132 2% 12646.6-
98Livingston County 130 2% 13946.6-
99Butler County 129 2% 14446.6-
100Carroll County 124 2% 12146.5-
101Cumberland County 117 2% 11446.4-
102Clinton County 114 2% 11646.4-
102McLean County 114 2% 11746.4-
102Lee County 114 2% 10946.4-
105Bracken County 113 2% 9746.4-
106Nicholas County 111 2% 10746.3-
107Owen County 107 2% 10346.3-
107Wolfe County 107 2% 11246.3-
107Fulton County 107 2% 11246.3-
110Crittenden County 106 2% 9846.2-
111Ballard County 103 1% 11046.2-
112Trimble County 99 1% 9546.1-
113Menifee County 85 1% 8345.9-
114Gallatin County 83 1% 8745.9-
115Owsley County 80 1% 5945.9-
116Hancock County 76 1% 7645.8-
117Hickman County 74 1% 6845.8-
118Carlisle County 69 1% 6645.7-
119Elliott County 65 1% 5745.6-
120Robertson County 31   2245.1-
Pickup
ランキングカテゴリ一覧
States

全米・死亡数(2011年7月~翌年6月末)ランキングマップ(郡別)

死亡数(2011年7月~翌年6月末)ランキング(郡別)の偏差値にしたがって色分けしたアメリカ合衆国の全郡マップです。アメリカ合衆国におけるすべての郡(州の下の地域区分)の平均と比べて、数値が高い地域はより赤く、数値が低い地域はより青く色分けしています。

アメリカ州のエリアをクリックしてください。その州内における郡のランキングページを表示します。

全米・死亡数(2011年7月~翌年6月末)ランキングマップ(郡別) アラバマ州 Alabama アラスカ州 Alaska アリゾナ州 Arizona アーカンソー州 Arkansas カリフォルニア州 California コロラド州 Colorado コネチカット州 Connecticut デラウェア州 Delaware フロリダ州 Florida ジョージア州 Georgia ハワイ州 Hawaii アイダホ州 Idaho イリノイ州 Illinois インディアナ州 Indiana アイオワ州 Iowa カンザス州 Kansas ケンタッキー州 Kentucky ルイジアナ州 Louisiana メイン州 Maine メリーランド州 Maryland マサチューセッツ州 Massachusetts ミシガン州 Michigan ミネソタ州 Minnesota ミシシッピ州 Mississippi ミズーリ州 Missouri モンタナ州 Montana ネブラスカ州 Nebraska ネバダ州 Nevada ニューハンプシャー州 New Hampshire ニュージャージー州 New Jersey ニューメキシコ州 New Mexico ニューヨーク州 New York ノースカロライナ州 North Carolina ノースダコタ州 North Dakota オハイオ州 Ohio オクラホマ州 Oklahoma オレゴン州 Oregon ペンシルベニア州 Pennsylvania ロードアイランド州 Rhode Island サウスカロライナ州 South Carolina サウスダコタ州 South Dakota テネシー州 Tennessee テキサス州 Texas ユタ州 Utah バーモント州 Vermont バージニア州 Virginia ワシントン州 Washington ウェストバージニア州 West Virginia ウィスコンシン州 Wisconsin ワイオミング州 Wyoming デラウェア州 Delaware メリーランド州 Maryland ニューハンプシャー州 New Hampshire ニュージャージー州 New Jersey マサチューセッツ州 Massachusetts コネチカット州 Connecticut ウェストバージニア州 West Virginia バーモント州 Vermont ロードアイランド州 Rhode Island
このページの冒頭に戻る