ノースカロライナ州の出生数ランキング
ノースカロライナ州の100郡を対象とした出生数(2010年7月~翌年6月末)についてのランキングです。アメリカ合衆国における「郡」(countyまたはcounty-equivalent)は、州(state)の下の行政区画です。

ノースカロライナ州のランキングの1位はMecklenburg Countyの13,690人、2位はWake Countyの12,319人、3位はGuilford Countyの6,017人です。
ノースカロライナ州のランキングの最下位(100位)はTyrrell Countyの44人です。
このランキングには、ランキングマップがあります。偏差値にしたがって地図上の地域を色分けすることで、ひと目で出生数(2010年7月~翌年6月末)の状況が分かるようになっています。
全米・出生数(2010年7月~翌年6月末)ランキング(州別)や全米・出生数(2010年7月~翌年6月末)ランキング(郡別)もあります。全米の郡別ランキングはサイズの大きなページとなるため、お使いのインターネット環境によっては、読み込みに時間がかかる場合があります。
ノースカロライナ州のページではノースカロライナ州についてのすべてのランキング順位を確認できます。
| 順位 | 郡 | 出生数(2010年7月~翌年6月末) |
人口(推計) |
偏差値 | 評価 |
|---|
| 1 | Mecklenburg County |
13,690人 |
  |
923,386人 | 111.3 | - |
| 2 | Wake County |
12,319人 |
|
906,905人 | 104.5 | - |
| 3 | Guilford County |
6,017人 |
|
489,676人 | 73.6 | - |
| 4 | Cumberland County |
5,917人 |
|
320,265人 | 73.1 | - |
| 5 | Forsyth County |
4,566人 |
|
351,387人 | 66.5 | - |
| 6 | Onslow County |
4,328人 |
|
179,487人 | 65.4 | - |
| 7 | Durham County |
4,188人 |
|
268,406人 | 64.7 | - |
| 8 | Gaston County |
2,576人 |
|
206,150人 | 56.8 | - |
| 9 | Buncombe County |
2,536人 |
|
238,862人 | 56.6 | - |
| 10 | Union County |
2,397人 |
|
202,162人 | 55.9 | - |
| 11 | Cabarrus County |
2,294人 |
|
178,516人 | 55.4 | - |
| 12 | Johnston County |
2,250人 |
|
169,636人 | 55.2 | - |
| 13 | New Hanover County |
2,227人 |
|
203,309人 | 55.0 | - |
| 14 | Pitt County |
2,100人 |
|
168,787人 | 54.4 | - |
| 15 | Robeson County |
1,927人 |
|
134,410人 | 53.6 | - |
| 16 | Catawba County |
1,780人 |
|
154,250人 | 52.9 | - |
| 17 | Iredell County |
1,770人 |
|
159,766人 | 52.8 | - |
| 18 | Davidson County |
1,744人 |
|
162,875人 | 52.7 | - |
| 19 | Harnett County |
1,740人 |
|
115,755人 | 52.7 | - |
| 20 | Alamance County |
1,718人 |
|
151,470人 | 52.6 | - |
| 21 | Craven County |
1,681人 |
|
103,891人 | 52.4 | - |
| 22 | Wayne County |
1,659人 |
|
122,882人 | 52.3 | - |
| 23 | Randolph County |
1,591人 |
|
141,860人 | 51.9 | - |
| 24 | Rowan County |
1,499人 |
|
138,364人 | 51.5 | - |
| 25 | Orange County |
1,237人 |
|
134,299人 | 50.2 | - |
| ノースカロライナ州郡の平均 |
1,197人 |
- |
95,590人 | 50.0 | - |
| 26 | Nash County |
1,121人 |
|
95,894人 | 49.6 | - |
| 27 | Cleveland County |
1,100人 |
|
98,030人 | 49.5 | - |
| 28 | Henderson County |
1,053人 |
|
106,951人 | 49.3 | - |
| 29 | Brunswick County |
1,022人 |
|
108,064人 | 49.1 | - |
| 30 | Wilson County |
1,010人 |
|
81,300人 | 49.1 | - |
| 31 | Hoke County |
970人 |
|
47,479人 | 48.9 | - |
| 32 | Moore County |
935人 |
|
88,544人 | 48.7 | - |
| 33 | Rockingham County |
933人 |
|
93,598人 | 48.7 | - |
| 34 | Sampson County |
843人 |
|
63,493人 | 48.3 | - |
| 35 | Burke County |
822人 |
|
90,774人 | 48.2 | - |
| 36 | Caldwell County |
816人 |
|
82,950人 | 48.1 | - |
| 37 | Lee County |
807人 |
|
57,877人 | 48.1 | - |
| 38 | Duplin County |
793人 |
|
58,676人 | 48.0 | - |
| 39 | Lincoln County |
781人 |
|
78,400人 | 48.0 | - |
| 40 | Surry County |
772人 |
|
73,682人 | 47.9 | - |
| 41 | Rutherford County |
702人 |
|
67,775人 | 47.6 | - |
| 42 | Stanly County |
680人 |
|
60,529人 | 47.5 | - |
| 43 | Franklin County |
663人 |
|
60,811人 | 47.4 | - |
| 44 | Wilkes County |
661人 |
|
69,220人 | 47.4 | - |
| 45 | Columbus County |
660人 |
|
57,927人 | 47.4 | - |
| 45 | Lenoir County |
660人 |
|
59,403人 | 47.4 | - |
| 47 | Chatham County |
647人 |
|
63,748人 | 47.3 | - |
| 48 | Edgecombe County |
641人 |
|
56,574人 | 47.3 | - |
| 49 | Carteret County |
619人 |
|
66,719人 | 47.2 | - |
| 50 | Halifax County |
600人 |
|
54,542人 | 47.1 | - |
| 50 | Pender County |
600人 |
|
52,375人 | 47.1 | - |
| 52 | Granville County |
588人 |
|
60,015人 | 47.0 | - |
| 53 | Richmond County |
585人 |
|
46,656人 | 47.0 | - |
| 54 | Vance County |
557人 |
|
45,358人 | 46.9 | - |
| 55 | Haywood County |
550人 |
|
58,972人 | 46.8 | - |
| 56 | Beaufort County |
507人 |
|
47,766人 | 46.6 | - |
| 57 | Pasquotank County |
500人 |
|
40,713人 | 46.6 | - |
| 58 | Scotland County |
455人 |
|
36,104人 | 46.4 | - |
| 59 | McDowell County |
447人 |
|
45,051人 | 46.3 | - |
| 60 | Jackson County |
416人 |
|
40,345人 | 46.2 | - |
| 60 | Person County |
416人 |
|
39,441人 | 46.2 | - |
| 62 | Stokes County |
403人 |
|
47,349人 | 46.1 | - |
| 63 | Yadkin County |
383人 |
|
38,402人 | 46.0 | - |
| 64 | Davie County |
381人 |
|
41,307人 | 46.0 | - |
| 65 | Dare County |
361人 |
|
34,008人 | 45.9 | - |
| 66 | Watauga County |
358人 |
|
51,010人 | 45.9 | - |
| 67 | Alexander County |
346人 |
|
37,234人 | 45.8 | - |
| 67 | Montgomery County |
346人 |
|
27,743人 | 45.8 | - |
| 69 | Bladen County |
341人 |
|
35,182人 | 45.8 | - |
| 70 | Macon County |
305人 |
|
33,929人 | 45.6 | - |
| 71 | Anson County |
275人 |
|
26,879人 | 45.5 | - |
| 72 | Transylvania County |
267人 |
|
33,064人 | 45.4 | - |
| 73 | Hertford County |
248人 |
|
24,599人 | 45.3 | - |
| 74 | Martin County |
245人 |
|
24,462人 | 45.3 | - |
| 75 | Ashe County |
238人 |
|
27,258人 | 45.3 | - |
| 76 | Greene County |
235人 |
|
21,360人 | 45.3 | - |
| 77 | Currituck County |
227人 |
|
23,647人 | 45.2 | - |
| 78 | Cherokee County |
219人 |
|
27,438人 | 45.2 | - |
| 79 | Caswell County |
216人 |
|
23,668人 | 45.2 | - |
| 80 | Warren County |
198人 |
|
20,927人 | 45.1 | - |
| 81 | Bertie County |
189人 |
|
21,233人 | 45.1 | - |
| 82 | Northampton County |
182人 |
|
22,011人 | 45.0 | - |
| 82 | Swain County |
182人 |
|
13,998人 | 45.0 | - |
| 84 | Madison County |
175人 |
|
20,773人 | 45.0 | - |
| 85 | Yancey County |
165人 |
|
17,787人 | 44.9 | - |
| 86 | Chowan County |
156人 |
|
14,758人 | 44.9 | - |
| 87 | Avery County |
153人 |
|
17,735人 | 44.9 | - |
| 88 | Mitchell County |
139人 |
|
15,539人 | 44.8 | - |
| 89 | Washington County |
136人 |
|
13,175人 | 44.8 | - |
| 90 | Perquimans County |
130人 |
|
13,482人 | 44.8 | - |
| 91 | Polk County |
117人 |
|
20,439人 | 44.7 | - |
| 92 | Jones County |
112人 |
|
10,081人 | 44.7 | - |
| 93 | Pamlico County |
101人 |
|
13,107人 | 44.6 | - |
| 94 | Graham County |
98人 |
|
8,868人 | 44.6 | - |
| 95 | Gates County |
96人 |
|
12,168人 | 44.6 | - |
| 96 | Alleghany County |
88人 |
|
11,148人 | 44.6 | - |
| 97 | Clay County |
81人 |
|
10,569人 | 44.5 | - |
| 98 | Camden County |
80人 |
|
9,983人 | 44.5 | - |
| 99 | Hyde County |
46人 |
|
5,803人 | 44.4 | - |
| 100 | Tyrrell County |
44人 |
|
4,413人 | 44.3 | - |
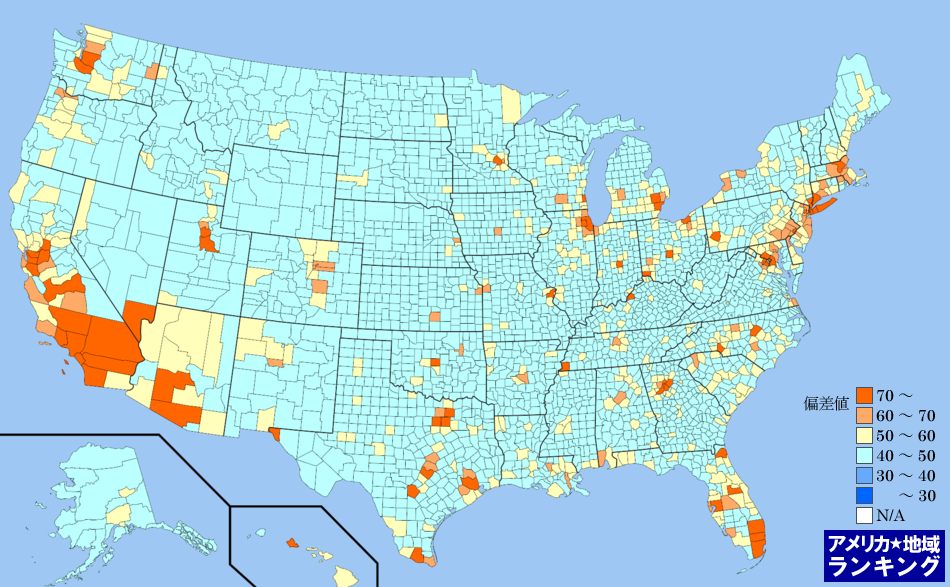
全米・出生数(2010年7月~翌年6月末)ランキングマップ(郡別)
出生数(2010年7月~翌年6月末)ランキング(郡別)の偏差値にしたがって色分けしたアメリカ合衆国の全郡マップです。アメリカ合衆国におけるすべての郡(州の下の地域区分)の平均と比べて、数値が高い地域はより赤く、数値が低い地域はより青く色分けしています。
アメリカ州のエリアをクリックしてください。その州内における郡のランキングページを表示します。